Another new poll today, this time by Quinnipiac University on the U.S. Senate race in Virginia. Here are a few highlights:
- Overall, Virginia voters say they’d vote for Sen. Tim Kaine over Republican Corey Stewart by an 18-point margin (54%-36%). Among Dems, support for Kaine is 95%-1%. Among Republicans, support for Stewart is 82%-8%. And among Independents, Kaine has a 54%-34% lead. Personally, I find it disturbing that ANYONE could vote for Corey Stewart. WTF? Regardless, the bottom line is that we need to put our pedals to the metal, not take this race for granted and push for a massive, landslide win for Kaine this November, both to send a clear and resounding message against everything Corey Stewart stands for and also to help win as many House of Representatives races as possible.
- Stewart leads among…yep, white men, by a 54%-37% margin, and also among whites without a college degree, by a 51%-39% margin. Kaine leads among everyone else, including non-whites by a 68%-20% margin; those with a college degree, by a 56%-35% margin; and women, by a 62%-28% margin.
- Kaine’s favorable/unfavorable rating is 51%-34% (+17 points), including 88%-1% among Dems, 51%-33% among Independents, and 11%-71% among Republicans.
- Corey Stewart has a 27%-30% favorable/unfavorable rating, with 40% not having heard enough to form an opinion. Wait until they find out more!
- Gov. Ralph Northam has an approval/disapproval rating of 49%-25% (+24 points) overall. Among Dems, it’s 70%-6%. Among Republicans, it’s 23%-48%. Among non-whites, it’s 49%-18%. Among women, it’s 53%-20%.
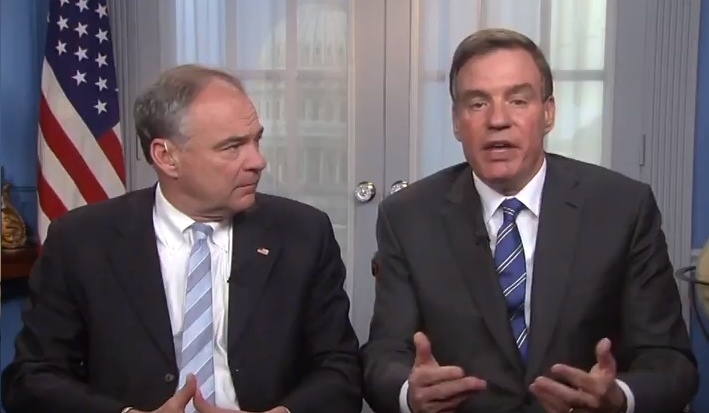
- Sen. Mark Warner has an approval/disapproval rating of 53%-31% (+22 points) overall. Among Dems, it’s 82%-7%. Among Republicans, it’s 31%-57%.
- Donald Trump gets a miserable, 38%-57% approval/disapproval score among Virginia voters overall. Among women, it’s even worse, at 29%-64%. And among non-whites, it’s even worse than that, at 23%-73%. Who approves of this @!@#!@? Yep, you guessed it – white men, at 57%-39%; and whites without a college degree, at 56%-39%. Ugh.
- Virginia voters don’t think highly of the Republican Party, with only 32% approving vs. 58% disapproving. Virginia voters are split on the Democratic party, with 45% approving and 46% disapproving.
- The “generic ballot” question has Virginia voters wanting Democrats to control the U.S. House and Senate by a 51%-40% and 51%-42% margin, respectively.
- By a 57%-4% margin, Dems say they are MORE motivated to vote in this election than in the past. In contrast, only 39% of Republicans say that they are more motivated to vote in this election than in the past. That’s a huge advantage for the Dems heading into November…
- What does embracing Trump do to a candidate’s popularity? Nothing good among voters overall (24% say it would them MORE likely to vote for the candidate vs. 48% who say “less likely”). Among Republicans, though, embracing Trump is a winner, by a 57%-8% margin. Hence, Republican candidates’ conundrum when it comes to Trump.
- How about embracing Corey Stewart? By a 32%-17% margin, Virginia voters say that would make them LESS likely to vote for a U.S. House candidate. Again, though, it’s actually a positive (by a 40%-7% margin) among Republican voters. So…if you’re Barbara Comstock, Scott Taylor, Dave Brat or Denver Riggleman, do you appear with Corey or not? Tough call politically, although easy call morally.
- The most important issues to Virginia voters are: 1) the economy (26%), 2) immigration (21%), 3) health care (20%), 4) gun policy (14%); 5) race relations (7%); 6) taxes (6%).
- By a 52%-42% margin, Virginia voters want to see the Affordable Care Act remain in place. And by a 47%-41% margin, Virginia voters disapprove of the 2017 GOP tax law.
- By a 60%-35% margin, Virginia voters SUPPORT stricter gun laws. Among women, it’s 69%-26%.
- On abortion, 64% of Virginia voters want it legal in all (24%) or most (40%) cases, with 21% wanting it illegal in “most cases” and just 9% wanting it illegal in “all cases.”
- On immigration, Virginia voters strongly (63%) want immigrants to “be allowed to stay in the United States and to
eventually apply for U.S. citizenship” Only 24% believe “[t]hey should be required to leave the U.S.” - On the DREAMers, 77% support allowing them “to remain in the United States and eventually apply for citizenship,” while just 18% oppose letting them do so.
- Virginia voters oppose “the wall” by a 59%-38% margin.
- On Confederate monuments, 33% support removing them from government property in Virginia, while 57% oppose doing so. Note that there’s a huge partisan divide here, with 91% of Republicans opposed to removing Confederate monuments and 61% of Democrats supporting.
- On the Confederate flag, 42% see it as a “symbol of racism,” while 46% see it as a “symbol of Southern pride.” Again, huge partisan divide here, with 77% of Republicans opting for “symbol of Southern pride” vs. 77% of Dems who say “racism.”