Tuesday night, on “The Last Word” with Lawrence O’Donnell, Christopher Newport University (CNU) Professor Rachel Bitecofer discussed her modeling/analysis about how “it’s all about the base” when it comes to Democrats winning elections while Trump is president. According to Bitecofer, “The time when you could persuade large swathes of the electorate over has passed. We are in a deeply hyperpartisan era now. I’m not saying that moderates aren’t important or that there aren’t moderates, there certainly are and they can be appealed to – although Democrats don’t do it well – but really it’s all about the base.”
I tend to agree with Bitecofer that it’s all – or at least mostly – about getting the Democratic “base” to turn out. I’d argue that is particularly the case in a traditionally low-turnout, “base” election like the off-odd 2019 Virginia legislative elections this November 5. Having said that, I also noted in my post that Bitecofer’s analysis differs significantly from Catalist, which found that it’s a combo of Dem turnout and Trump defectors. According to Catalist, “the party’s big gains in the 2018 congressional election were fueled not only by unusually high turnout among voters sympathetic to the party, but also by larger-than-expected defections from the GOP among voters who had backed Trump two years earlier.”
So…that’s a big difference between Catalist and Bitecofer – “persuasion” vs. “all about the base.” How to reconcile the two? Here’s a “tweetstorm” by Professor Bitecofer, which explains how she views it. Very interesting, although I must say I’m still not 100% clear how these two starkly different views can be reconciled.
********************
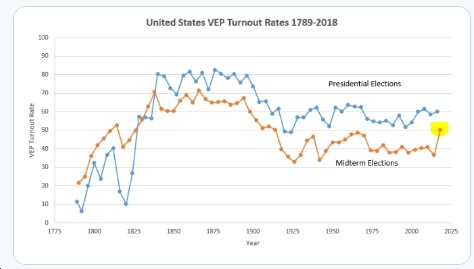
“An analysis by Catalist writes that “90% of the gains Ds made in 2018 are from persuasion.” This analysis is cited often, including by @Lawrence‘s guest following me (@neeratanden) as evidence that the D’s 2018 House wave was not a product of turnout. I will be addressing this analysis in detail in my forthcoming voter file analysis, but I would like to explain a couple of major things about what the Catalist analysis shows. But first, I want to encourage everyone to take a 30,000 ft view of this claim. The turnout in the 2018 midterms was historic, it literally doubled from the last midterm (2015), so clearly turnout was a MAJOR factor. The Catalist analysis, which relies on the company’s modeled data, compares voter behavior from the 2018 midterm to the 2016 presidential cycle. The fact that they can do so, that such as comparison doesn’t look crazy to make, is also a testament to the powerful role that turnout played in the 2018 cycle. Because usually a midterm participation rate is going to be 20 or even more points lower than a POTUS cycle rate.”

Catalist concludes there was a huge turnout surge but that the vast majority of D gains come from from Trump voters moving to Ds. What they don’t make clear enough is that they are talking about Indies. Indies swing against the party in power, & as expected moved away from Trump pic.twitter.com/KERx1lKFRN
— Rachel “The Doc” Bitecofer ???? (@RachelBitecofer) August 21, 2019
Catalist then deploys a formula to articulate what portion of the Democrats’ national House margin came from turnout & what portion came from people (ostensibly) changing their votes comparing 2012 to 2014 and 2016 to 2018 to show that in 2014, turnout was a much larger factor
than in 2018. Under my theory, turnout would be the main factor in both elections. The D’s turnout collapse in 2014 is just as imp in explaining their defeat that cycle as the D’s turnout surge would be in explaining their 2018 wins. One thing is for sure: we have analogous pic.twitter.com/IHncoLszEq
— Rachel “The Doc” Bitecofer ???? (@RachelBitecofer) August 21, 2019
scenarios in terms of Indies in both cycles. In 2014 Indies broke in favor of Rs at the same rate that they would go on to break in favor of Ds in 2018. And under my theory, pure Indies are going to break against the party in power, bc they are non-ideological, fairly low interest voters who do vote, but are generally unhappy w the status quo bc well, in case you haven’t noticed, even before Trump came along, our status quo hasn’t been doing all that well and these voters, these are the ones I think are your quintessential “swingers.” I am not a stats person. I know, I know, you’re probably thinking, “but Dr. B!” but seriously, I am not! If I was, with my BIG IDEAS I would be at a swanky R1 institution. As such, I am not positioned to dissect or analyze catalist’s methodology in anyway. BUT I will say, my
belief is that some of what drives the results of the above equations is that it is the aggregate (total) vote and we’re looking at D surge and not D decline (as opposed to 2012->2014 which was D decline and not D surge). And the reason I think that matters is bc of these graphs pic.twitter.com/n3TAma1NKq
— Rachel “The Doc” Bitecofer ???? (@RachelBitecofer) August 21, 2019
Because, these graphs suggest that in the very places my model is based turnout, not “persuasion” was by far the most important factor. Indeed, for the House graph, that lovely cluster I have highlighted in yellow, at 0% margin change due to vote choice, those are my districts! And you can also see the lovely @staceyabrams over there on the statewide graph, also at 0% vote choice. And if poor @BetoORourke had focused on Latino turnout, & not 256 counties, he might be over there too and might have actually flipped TX. (notice the other losers MO & IN?). The statewide and House level graphs tell me that overall, Catalist’s analysis is pretty good. But yeah, keep in mind, we’re talking about the predicted movement of the pure Indies largely. And in my analysis, what we’re going to be looking at 2014 to 2018, which I think is the appropriate approach. Oh, one more thing. I did ask Catalist for the individual races numbers but they were not able to provide them. This was long ago, when the analysis 1st dropped, bc I actually feel that their analysis largely supports my model (as the two graphs show).
Here is a link to catalist’s analysis. https://t.co/JRO3WpxRiH
— Rachel “The Doc” Bitecofer ???? (@RachelBitecofer) August 21, 2019


![Video: Sen. Mark Warner Says Last Night, “you saw an angry old man [Trump] giving a partisan screech that doesn’t solve anything”](https://bluevirginia.us/wp-content/uploads/2025/12/warner1218-100x75.jpg)
