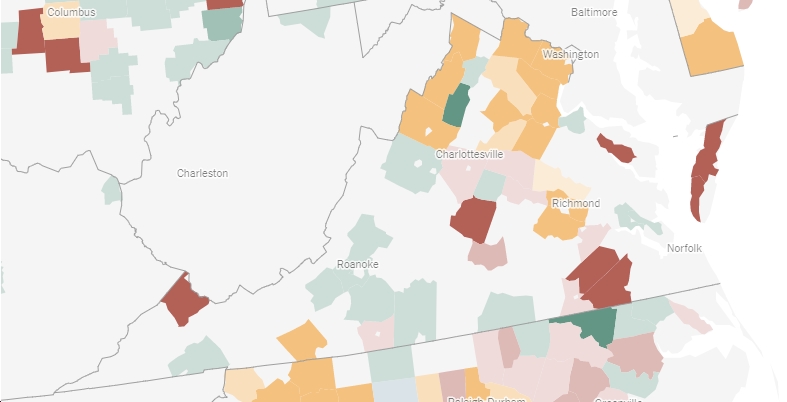
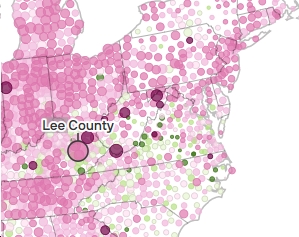
 Where are COVID-19 cases increasing (or decreasing) in Virginia? Check out this interactive map by Axios, in which “Each circle is a county sized by the 7-day average of cases per 100,000 people
and colored by the 14-day change in cases as of Nov. 16, 2020” For Virginia, here are a few data points that jumped out at me:
- Virginia looks better than a lot of other states, actually, with a fair amount of green (a 14-day decrease in cases as of 11/16), and a good amount of coloration indicating no growth or slow growth. Compare that to Ohio, Tennessee, Indiana, etc., and we’re clearly better off that they are in terms of COVID-19 cases.
- Some of the highest 14-day increases in cases were in: Rockbridge County (+600%), Culpeper County (+427.8%), Northampton County (+400%), Wythe County (+340%), Sussex County (+233%), Powhatan County (+185%), Amelia County (+175%), Pulaski County (+160%), Greene County (+150%), Fauquier County (+124%), Halifax County (+108%), Surry County (+100%), Tazewell County (+96.9%), Patrick County (+88.9%), Loudoun County (+82.2%), Buchanan County (+80.0%), etc.
- Some areas of 14-day decline in cases include: Buckingham County (-87.1%), Lunenberg County (-60%), Craig County (-53.8%), Alleghany County (-53.7%), Southampton County (-44.4%), Pittsylvania County (-34.6%), Middlesex County (-33.3%), Louisa County (-30.4%), Roanoke County (-23.2%), Montgomery County (-22.6%), Lynchburg (-22.3%), Appomattox County (-20%), Franklin County (-15.9%), etc.
- A few more big ones include: Chesterfield County (+58.1%), Virginia Beach (+55.9%), Arlington County (+48.1%), Fairfax County (+45.8%), Norfolk (+16.7%), Stafford County (+33.8%), Richmond City (+9.8%), Albemarle County (+9.6%), Henrico County (+7.5%), Prince William County (+7.4%), etc.
- What else jumps out at you?