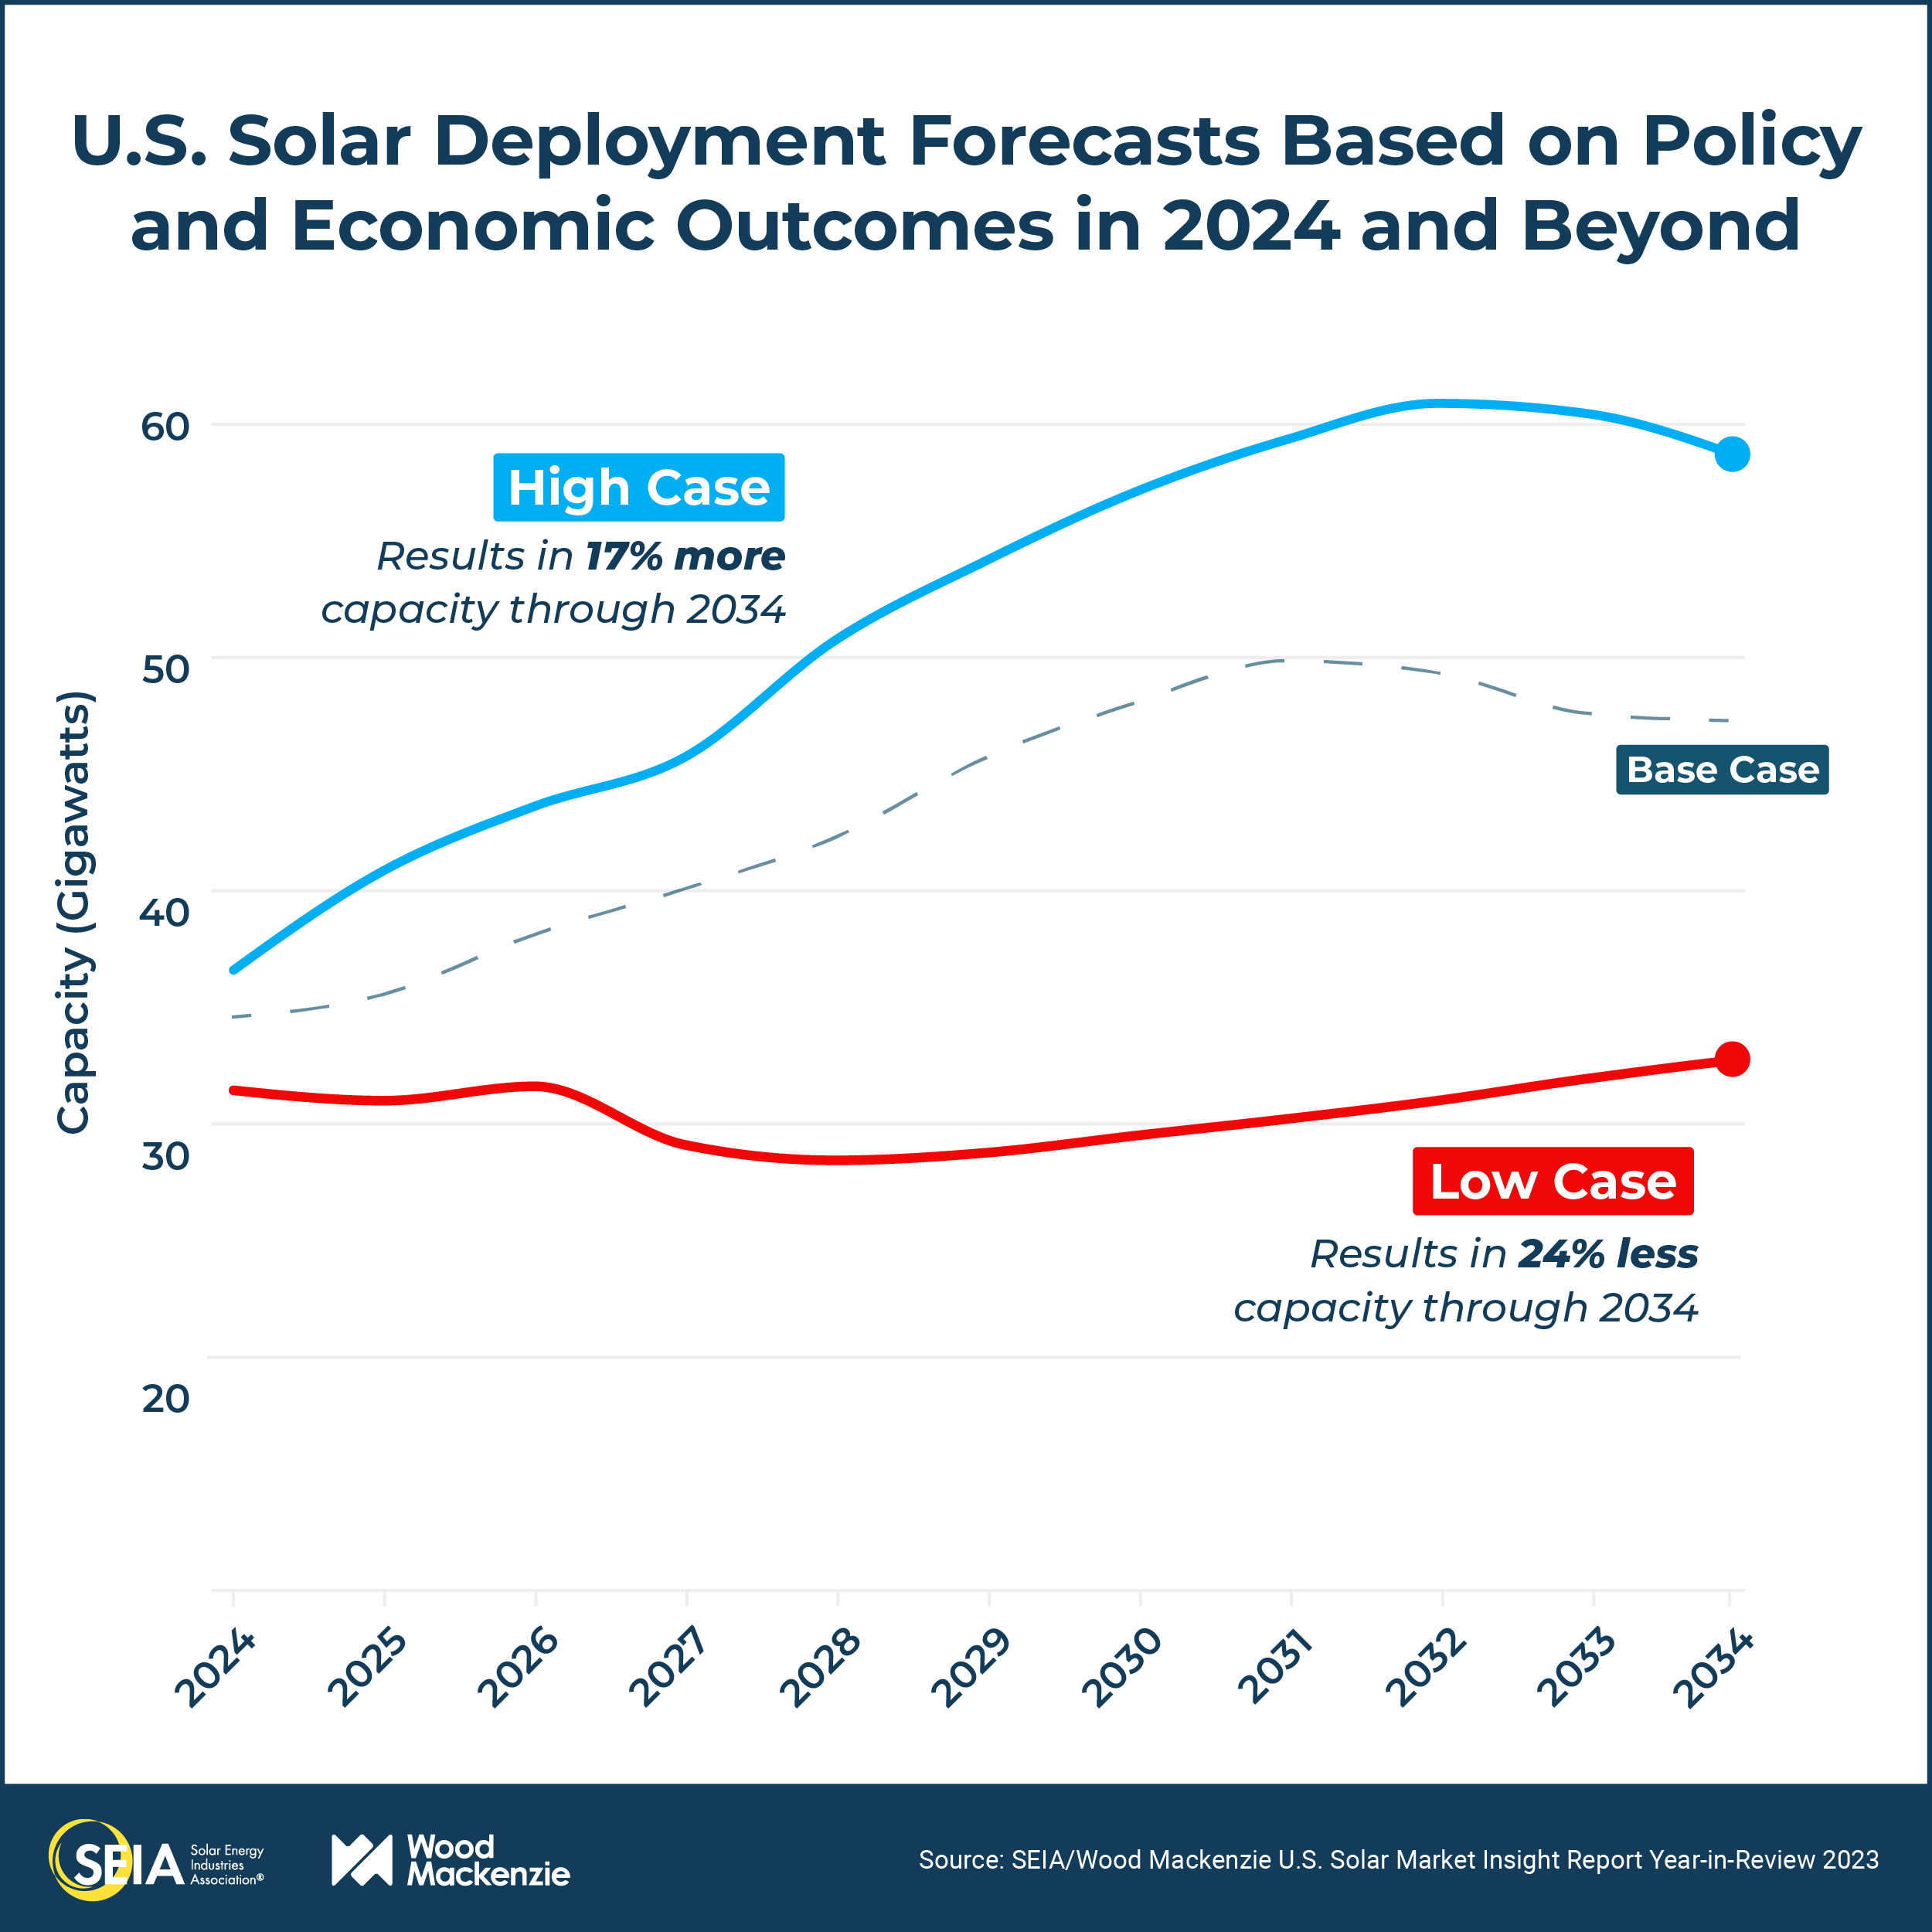
From SEIA and Wood Mackenzie – another major accomplishment of the Biden administration and Congressional Democrats!
| Solar Installations Skyrocket in 2023 in Record-Setting First Full Year of Inflation Reduction Act For the first time in history, solar accounts for over 50% of new electricity capacity added to the grid |
| Mar. 6, 2024 |
| FOR IMMEDIATE RELEASE |
| WASHINGTON D.C. — The U.S. solar industry added a record-shattering 32.4 gigawatts (GW) of new electric generating capacity in 2023, a 37% increase from the previous record set in 2021 and a 51% increase from 2022.
According to the U.S. Solar Market Insight 2023 Year-in-Review released today by the Solar Energy Industries Association (SEIA) and Wood Mackenzie, solar accounts for 53% of all new electric generating capacity added to the grid last year. This marks the first time in 80 years that a renewable electricity source has accounted for over 50% of annual capacity additions. “If we stay the course with our federal clean energy policies, total solar deployment will quadruple over the next ten years,” said SEIA president and CEO Abigail Ross Hopper. “The Inflation Reduction Act is supercharging solar deployment and having a material impact on our economy, helping America’s solar module manufacturing base grow 89% in 2023. We must protect and optimize the policies that are driving these investments and creating jobs, and the stakes in the upcoming election couldn’t be higher.” Total U.S. solar capacity is expected to grow to 673 GW by 2034, enough to power more than 100 million homes. The report includes forecast scenarios that show how policy and economic factors could impact the solar market. The U.S. solar industry currently faces several uncertainties, including policy outcomes associated with the upcoming presidential election. The scenarios consider various factors including interest rates, tax credit financing, trade policy, supply chain availability, and interconnection, amongst others, over the next 10 years. There is a 200 GW difference between the high- and low-case forecasts by 2034.
“A high case for U.S. solar with increased supply chain stability, more tax credit financing, and lower interest rates would increase our outlook 17%,” said Michelle Davis, head of global solar at Wood Mackenzie and lead author of the report. “A low case with supply chain constraints, less tax credit financing, and static interest rates would decrease our outlook 24%. Various policy and economic outcomes will have big implications for the U.S. solar industry.” Solar module manufacturing capacity grew from 8.5 GW to 16.1 GW in 2023. However, record-low prices for modules and a tough economic environment could make it difficult for U.S. manufacturers to follow through on announced facilities. In 2023, prices for monofacial and bifacial solar modules fell 26% and 31%, respectively. The United States currently does not have any ingot, wafer, or cell manufacturing facilities in operation, representing an opportunity for growth. Every solar market segment saw year-over-year growth in 2023, bringing total installed solar capacity in the United States to 177 GW. The utility-scale sector alone added 22.5 GW of new capacity, while nearly 800,000 Americans added solar to their homes. Energy storage use continues to grow across the country. In 2023, solar + storage accounted for 13% of residential installations and 5% of non-residential installations. In 2024, 25% of new residential installations and 10% of non-residential installations will have storage. Texas led the nation for new solar installations with 6.5 GW, eclipsing California for the second time in the last three years. California’s residential solar market will struggle in 2024 after changes to net metering policies take effect, contributing to a projected 36% decline across all segments in the state. Colorado and Ohio are among the top 10 solar states in 2023 for the first time in over a decade, while Wisconsin made its debut appearance in the top 10. More than half of U.S. states have 1 GW of total installed solar capacity. Learn more at seia.org/smi. ### |
| About SEIA®:
The Solar Energy Industries Association® (SEIA) is leading the transformation to a clean energy economy, creating the framework for solar to achieve 30% of U.S. electricity generation by 2030. SEIA works with its 1,200 member companies and other strategic partners to fight for policies that create jobs in every community and shape fair market rules that promote competition and the growth of reliable, low-cost solar power. Founded in 1974, SEIA is the national trade association for the solar and solar + storage industries, building a comprehensive vision for the Solar+ Decade through research, education and advocacy. Visit SEIA online at www.seia.org. About Wood Mackenzie: Wood Mackenzie is the global insight business for renewables, energy and natural resources. Driven by data. Powered by people. In the middle of an energy revolution, businesses and governments need reliable and actionable insight to lead the transition to a sustainable future. That’s why we cover the entire supply chain with unparalleled breadth and depth, backed by over 50 years’ experience in natural resources. Today, our team of over 2,000 experts operate across 30 global locations, inspiring customers’ decisions through real-time analytics, consultancy, events and thought leadership. Together, we deliver the insight they need to separate risk from opportunity and make bold decisions when it matters most. For more information, visit woodmac.com. |


![Monday News: Trump’s Lunacy Pushes China, Russia, India, etc. Together; “Happy Labor Day. Donald Trump and Elon Musk Are Screwing Workers.”; “Where is the [media’s] intense focus on Trump’s failing health?”; ““Trump says he is not a dictator. Isn’t he?”](https://bluevirginia.us/wp-content/uploads/2025/09/montage0901-238x178.jpg)


