Back on April 3, I looked at how Virginia was doing in Unacast’s Social Distancing Scoreboard, which the L.A. Times describes as: “[using] data from millions of anonymous mobile phones to compare the distance that people in each county in the United States traveled before the outbreak began and after it took hold. Areas that observe at least a 40% decrease in average distance traveled are assigned an A grade, while those that show less than a 10% decrease or an increase are given an F, Unacast CEO Thomas Walle wrote in a post on the company’s website.” Also note that the scoring methodology “incorporates the reduction in non-essential visitation (in addition to our previous metric, reduction in distance traveled)” and that “we’ve been contacted by government officials and health policy experts at the local, state, and federal levels expressing great enthusiasm for our aggregated analysis and partnering with us to make their response to COVID-19 even better and smarter.”
So anyway, 23 days ago, Virginia scored a “D” grade, 8th-worst in the country, even as the vast majority of “A” and “B” grades were among “blue states, counties and cities. Withing Virginia, back on April 3, at the top were strongly “blue” areas – Lexington City (A), Arlington County (A-), Alexandria (A-), Charlottesville (A-), Williamsburg (A-). Then there were the “B” grades – Fairfax County, James City County, Loudoun County, Mathews County, Nelson County, Rappahannock County, Falls Church, Harrisonburg, Albemarle County, Lynchburg, Richmond City – again, most of which are “blue” areas. As for the “C” jurisdictions – and there were a lot of them – they were a mix of “blue,” “purple” and “red” areas, including Henrico County, Prince William County, Spotsylavnia County, Fairfax City, Roanoke City, Newport News and Winchester. Finally, there was a looong list of areas with “D” and even “F” scores, the vast majority of these in deep-“red” areas (e.g., Shenandoah, Wythe, Washington, Rockbridge…), with a few exceptions like Chesapeake and Norfolk.
So…over three weeks later, how is Virginia doing? See below for the gory details, but in short:
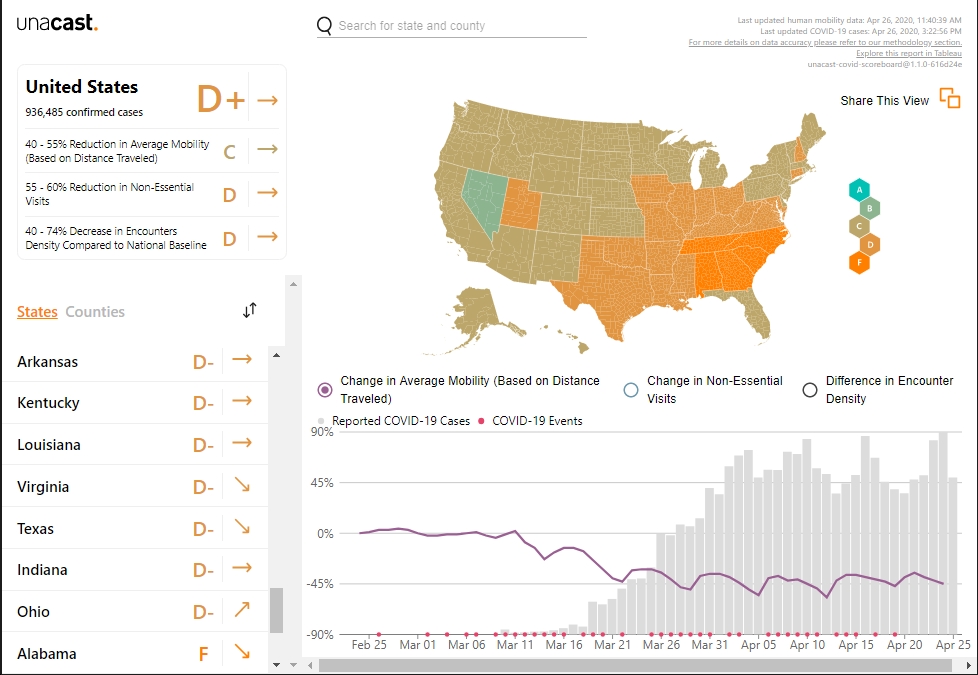
- The U.S. as a whole received a “C” grade back on April 3, but now has slipped to a D+ grade. Now, I may not be an epidemiologist, but that certainly doesn’t seem to be moving in the right direction.
- Also not good: not a single state now gets an “A” grade, whereas on April 3, there were eight states plus D.C. which got “A”s.
- The best states in the country now, at least on Unacast’s scorecard? All “blue”: Nevada (B+), New Mexico (C+), Vermont (C+), Colorado (C+), Hawaii (C+), D.C. (C+)…
- The worst states in the country? Mostly southern (and also mostly “red”) states like Georgia (F), South Carolina (F), North Carolina (F), Tennessee (F), Alabama (F), and Texas (D-), Louisiana (D-), Kentucky (D-), Arkansas (D-), Oklahoma (D-), and Mississippi (D-). Sensing a pattern here.
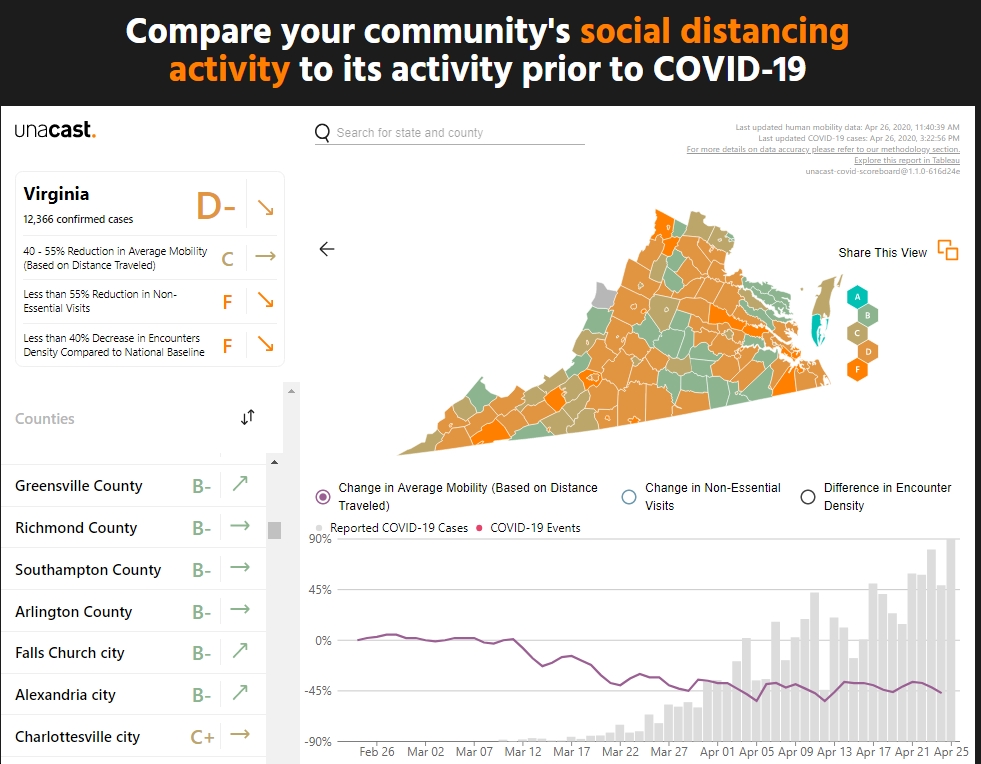
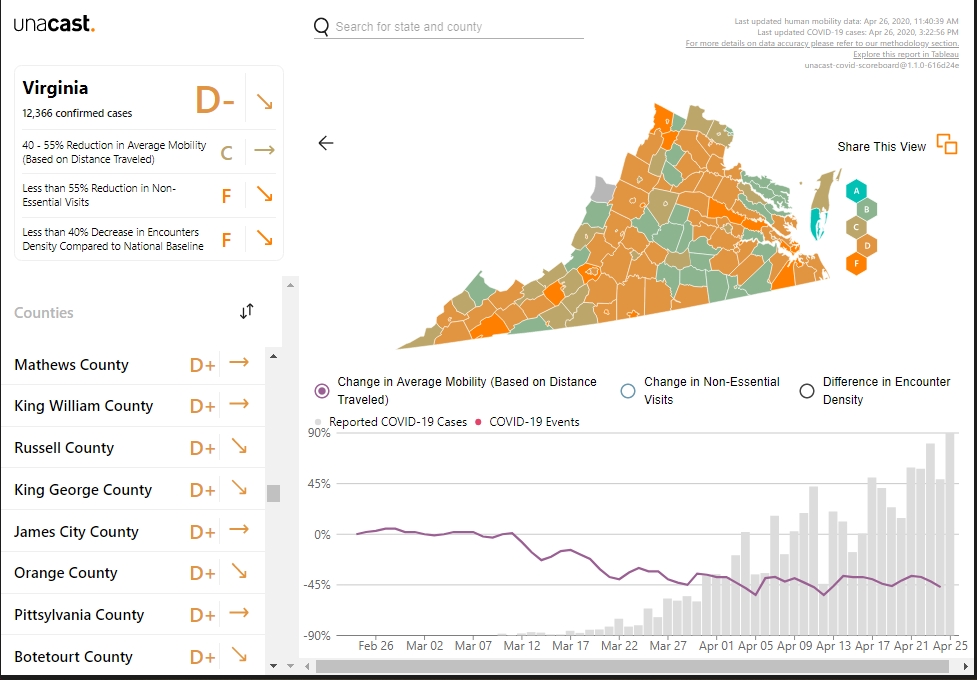
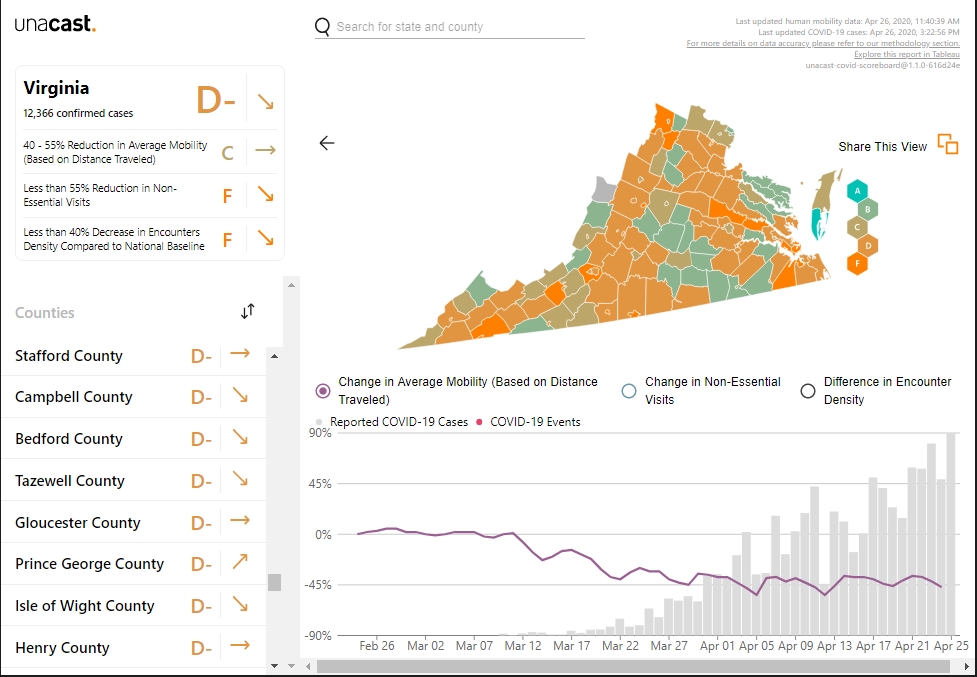
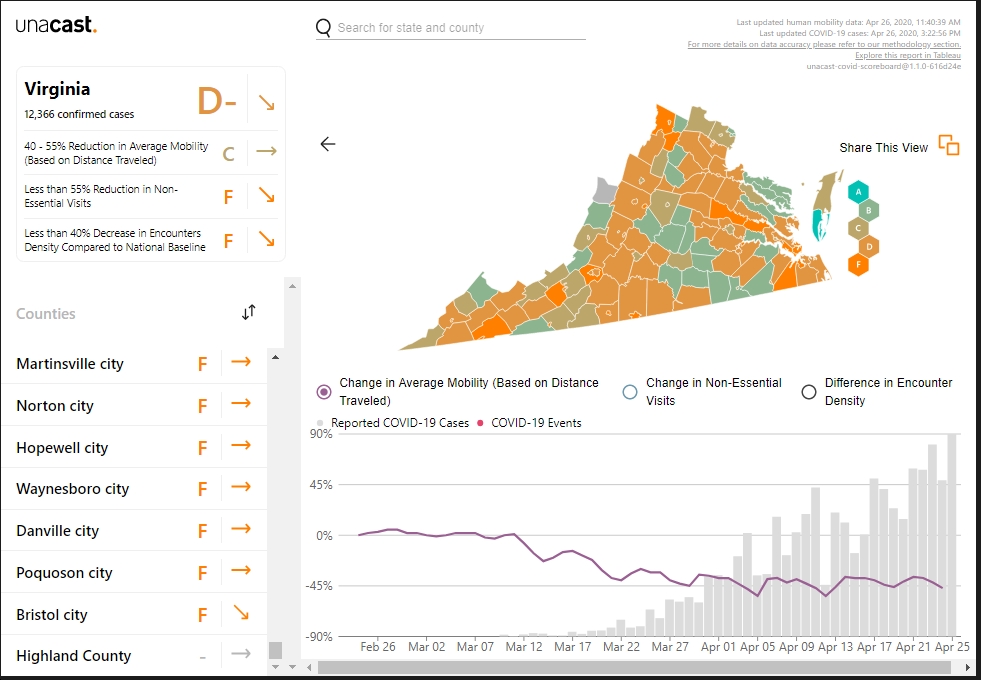
- As for Virginia, despite being a “blue” state, we now get a “D-” grade (slightly worse than three weeks ago), 9th-worst in the country (compared to 8th-worst on April 3). Again, not moving in the right direction.
- Within Virginia, only 31 jurisdictions get B- or higher grades, with Northampton County being the only jurisdiction currently above a “B” grade.
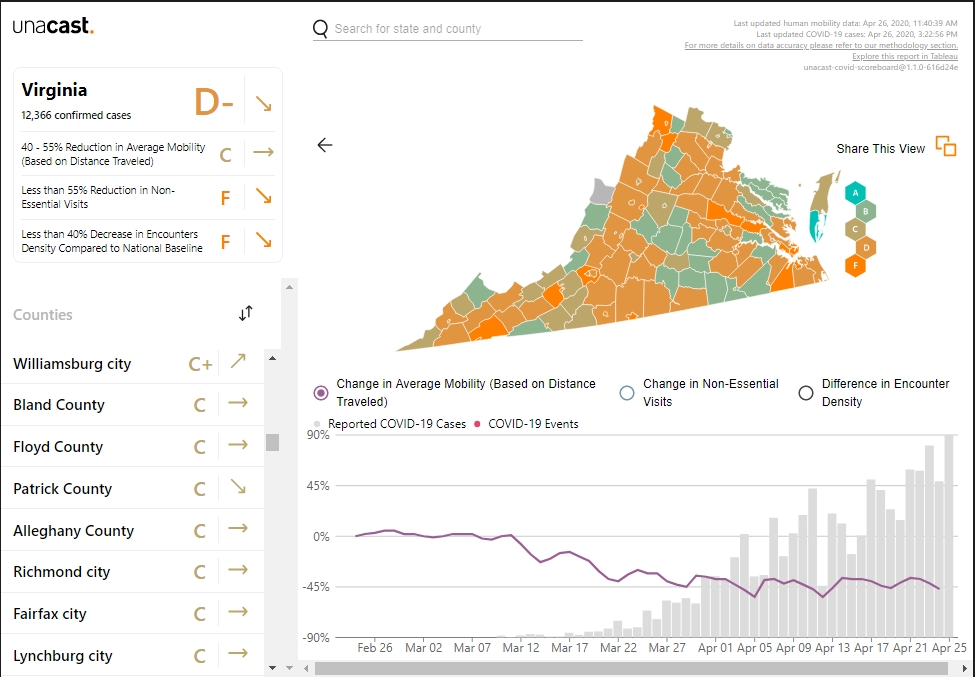
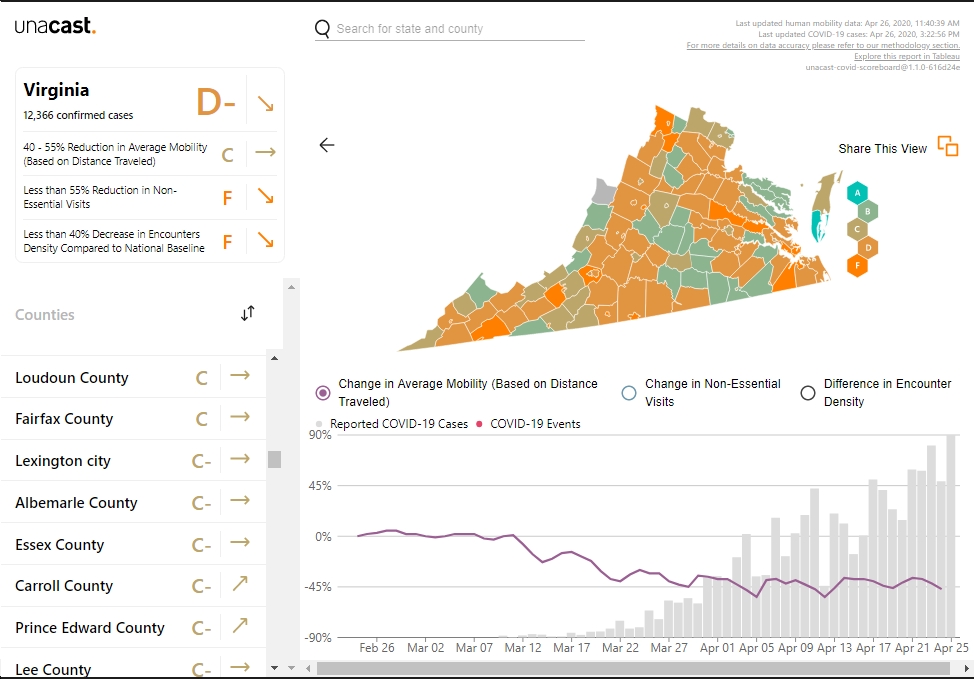
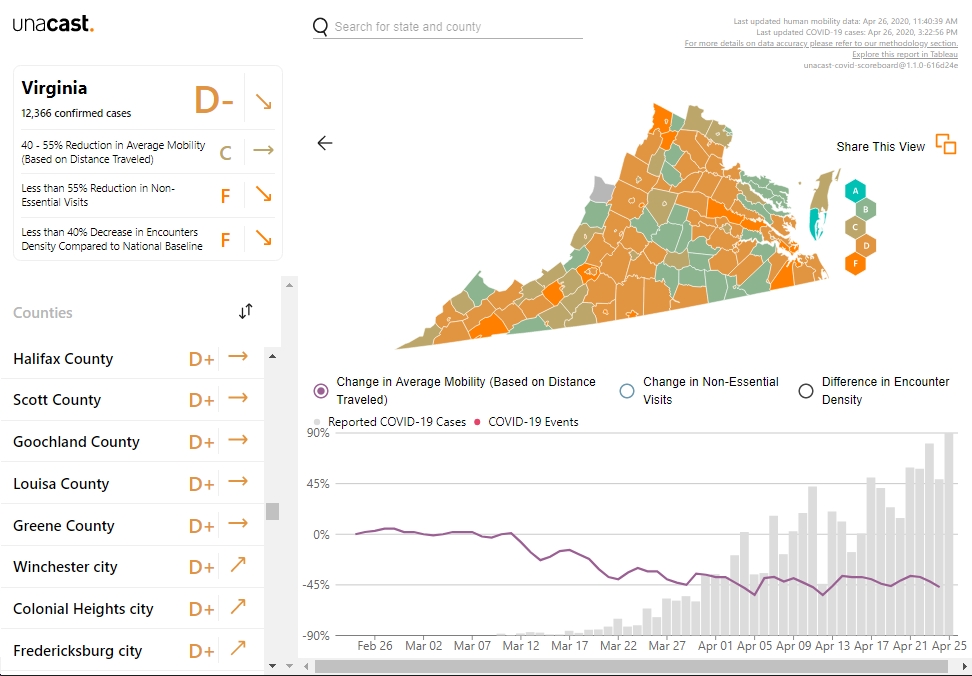
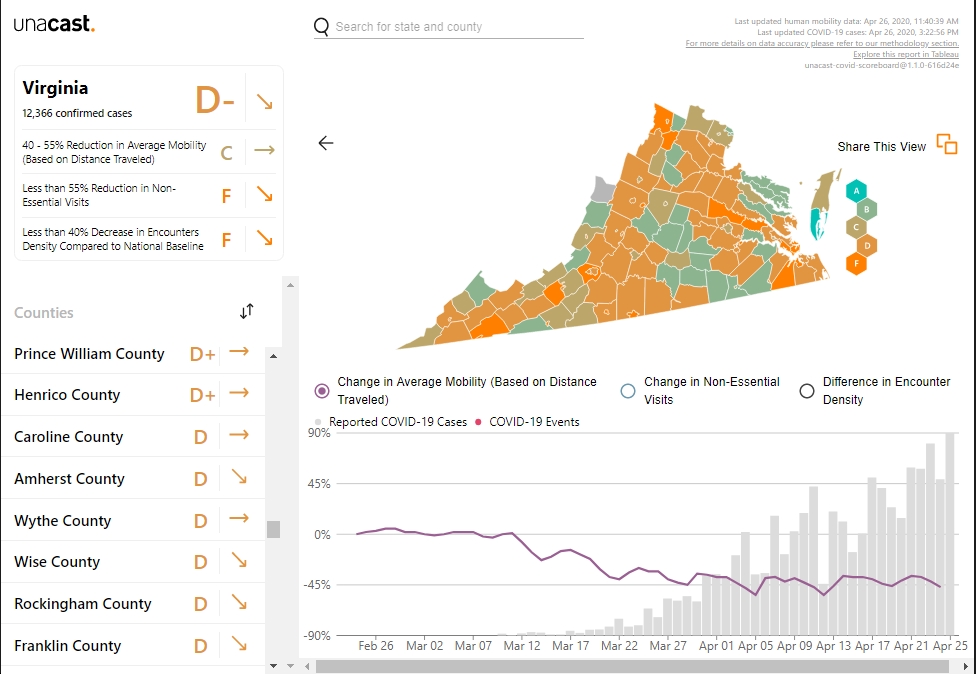
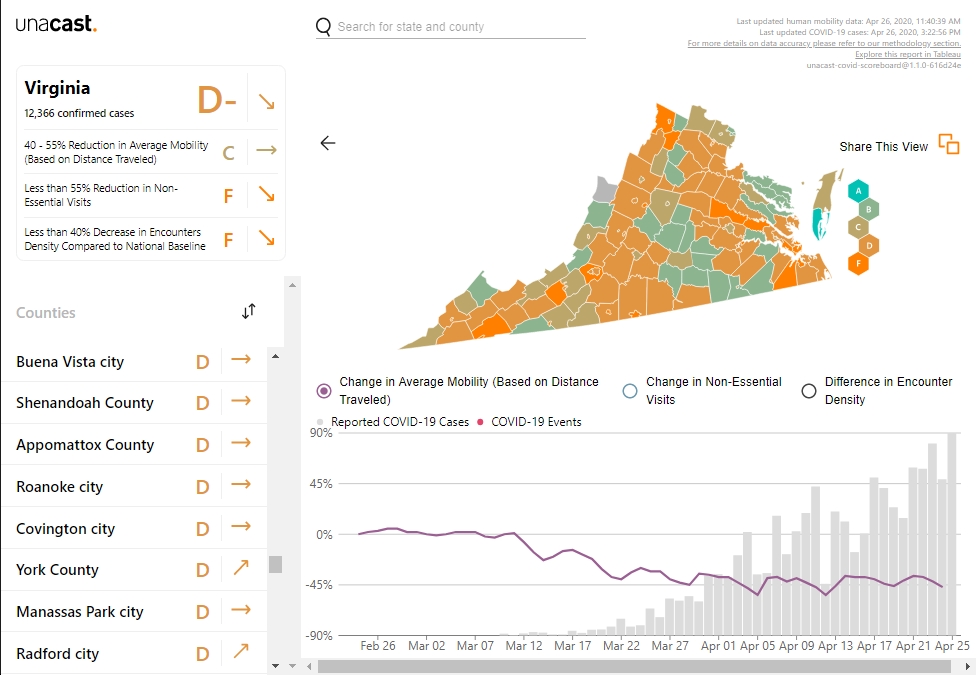
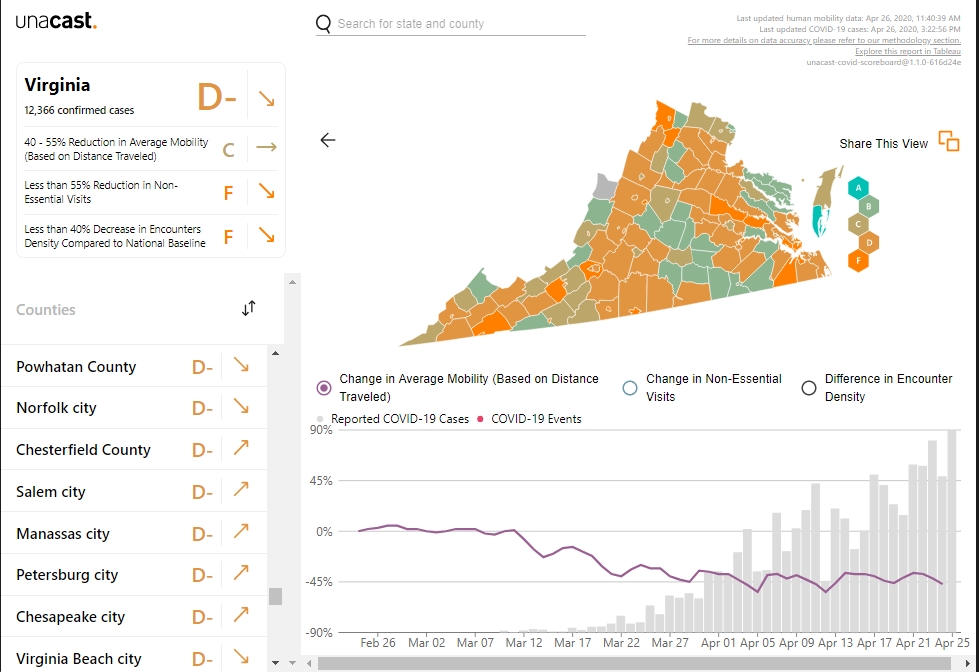
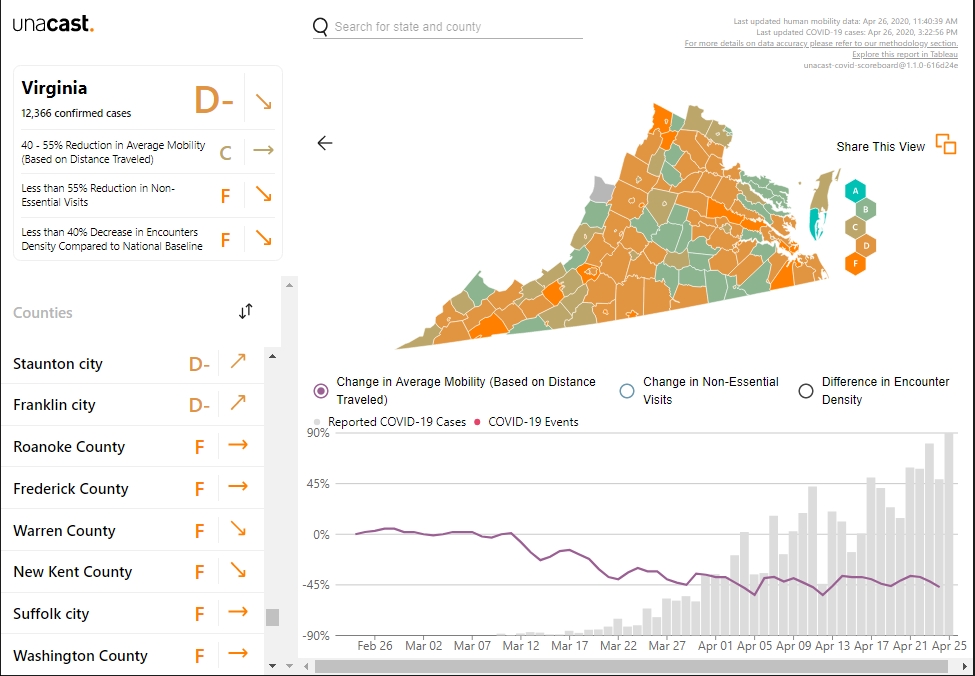
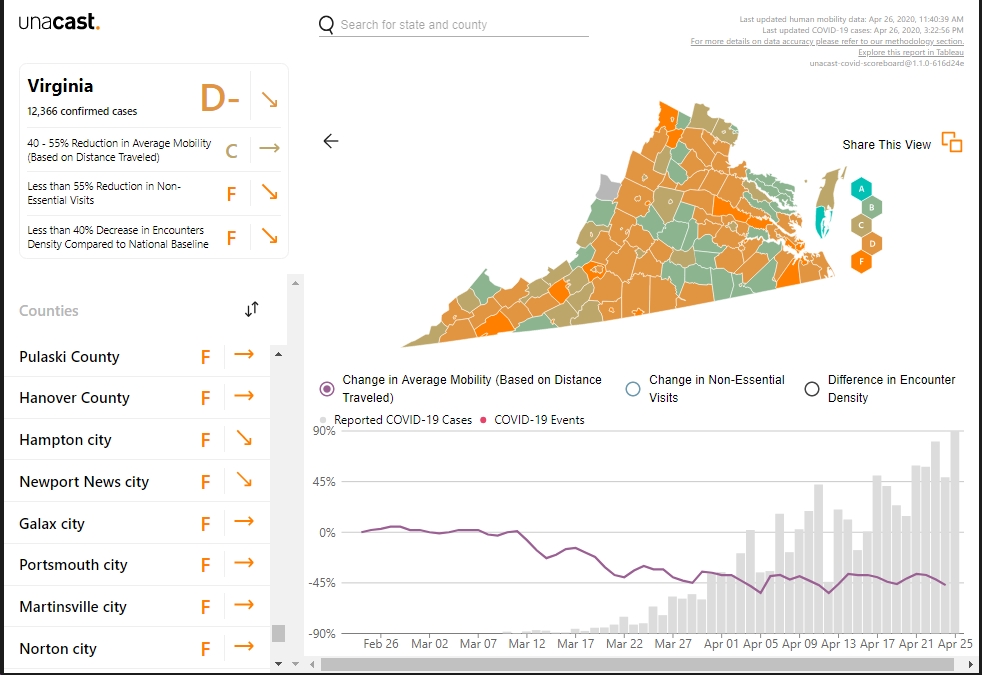
- There are a slew of “D”s and “F”s, with the worst jurisdictions including a lot of rural/”red” counties, plus a few cities and urban/suburban/”blue” areas like Fredericksburg (D+), Prince William County (D+), Roanoke City (D), Norfolk (D-), Manassas City (D-), Chesapeake (D-), Virginia Beach (D-), Suffolk (F), Newport News (F), Portsmouth (F), etc.
- Some of the largest jurisdictions in the state get “C” or “C-” grades: Fairfax County (C), Richmond City (C), Loudoun County (C), Lynchburg (C), Albemarle County (C-)…
Bottom line: it’s not looking great, at least on this scorecard, either nationally or in Virginia. Of course, it might be good to have strong leadership from the White House, but…nope, forget about that! Still, I do find it a bit puzzling that we seem to be backsliding, as I definitely would have expected grades to go up over time. Any theories? Is Unacast’s methodology flawed? Are Americans simply not adhering to social distancing guidelines, as they should be doing? Other ideas?