Several weeks into the Coronavirus pandemic crisis, one thing we know for sure is that social distancing is a crucial countermeasure we all need to be adhering to. Of course, we have a federal system in the United States, which means that different states – and different parts of the country – are behaving much differently than other states/regions in this regards. How well or badly are different states doing? See below for a bunch of maps that lay it all out.
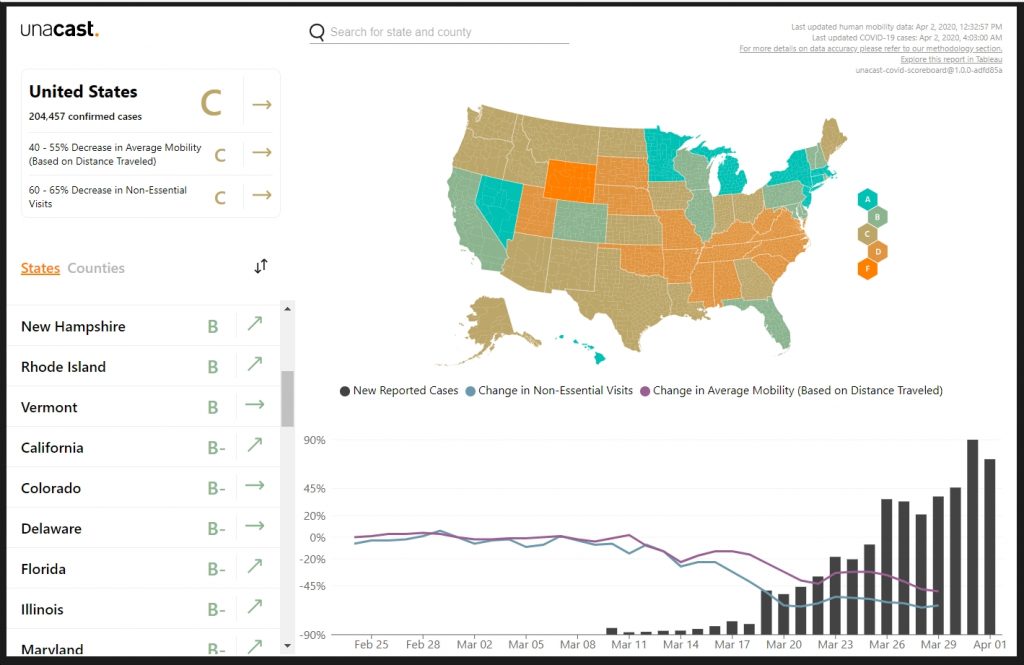
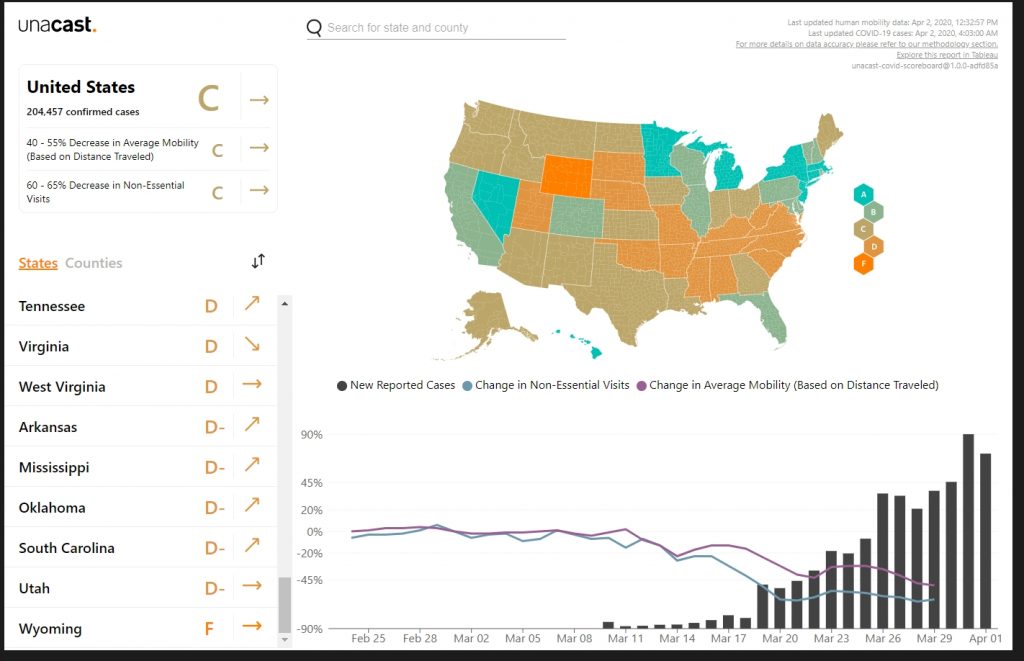
First, see below for the United States as a whole, with states ranked in descending order by Unacast’s Social Distancing Scoreboard, which the L.A. Times describes as: “[using] data from millions of anonymous mobile phones to compare the distance that people in each county in the United States traveled before the outbreak began and after it took hold. Areas that observe at least a 40% decrease in average distance traveled are assigned an A grade, while those that show less than a 10% decrease or an increase are given an F, Unacast CEO Thomas Walle wrote in a post on the company’s website.”
[Note: There’s a lot more on the Unacast methodology here. It’s now been updated/refined as follows: “An updated grading system that’s more in line with what’s been learned about the virus since our initial launch; A scoring methodology that now incorporates the reduction in non-essential visitation (in addition to our previous metric, reduction in distance traveled)” And: “we’ve been contacted by government officials and health policy experts at the local, state, and federal levels expressing great enthusiasm for our aggregated analysis and partnering with us to make their response to COVID-19 even better and smarter.”]
As you can see from the following screenshots, states receiving “A” or “A-” grades are D.C. and several “blue” states – HI, CT, MA, MI, MN, NJ, NV, NY.
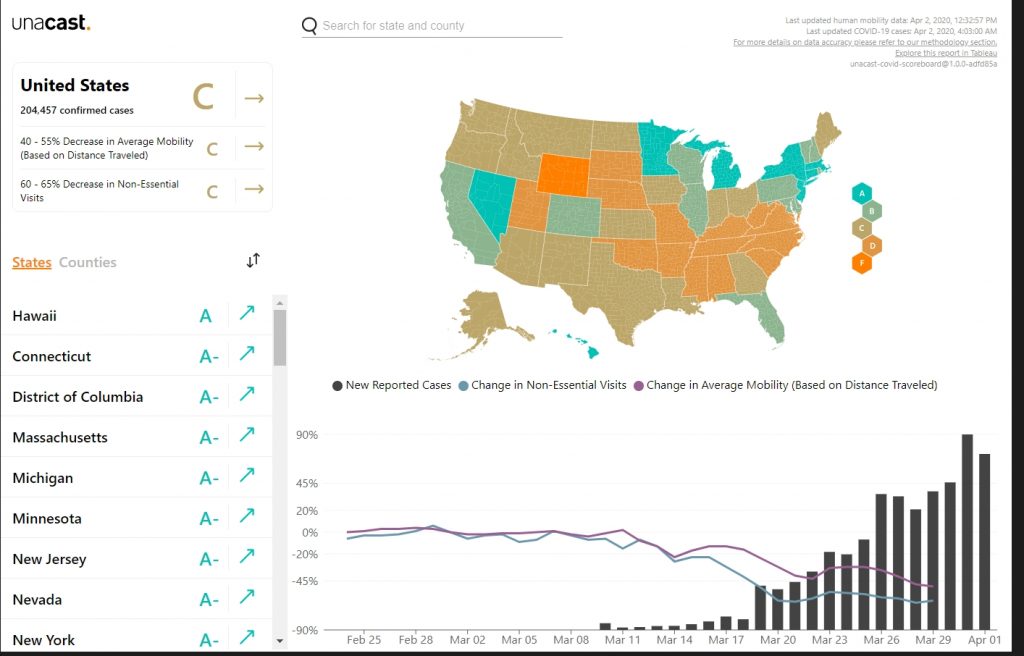
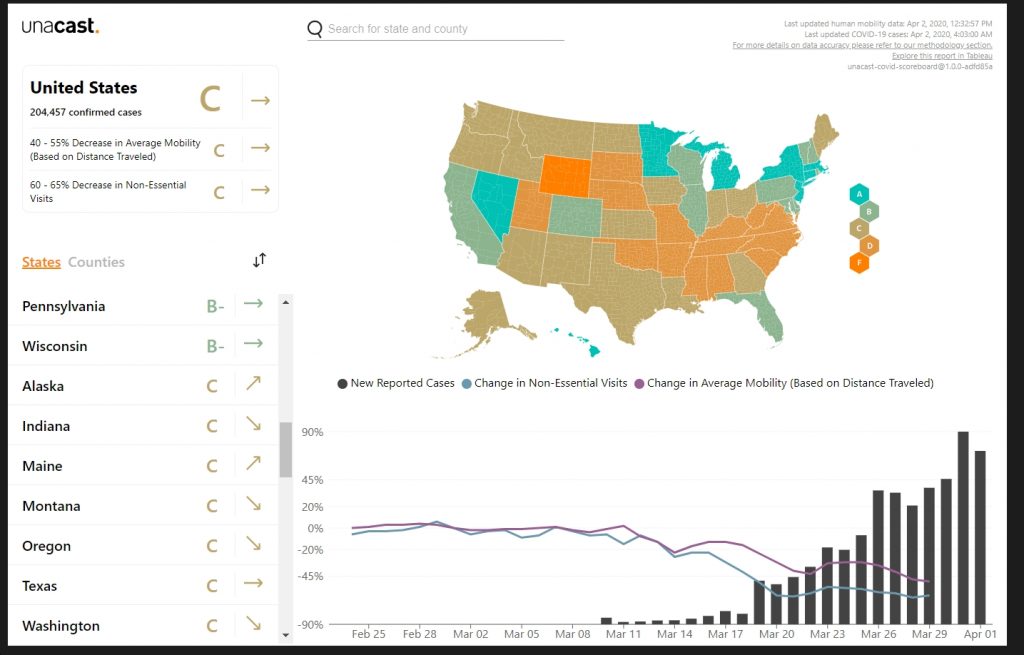
Next, states receiving “B” or “B-” grades are mostly “blue” states as well – NH, RI, VT, CA, CO, DE, IL, MD – with a few “purple” states in there as well, such as FL, PA and WI.
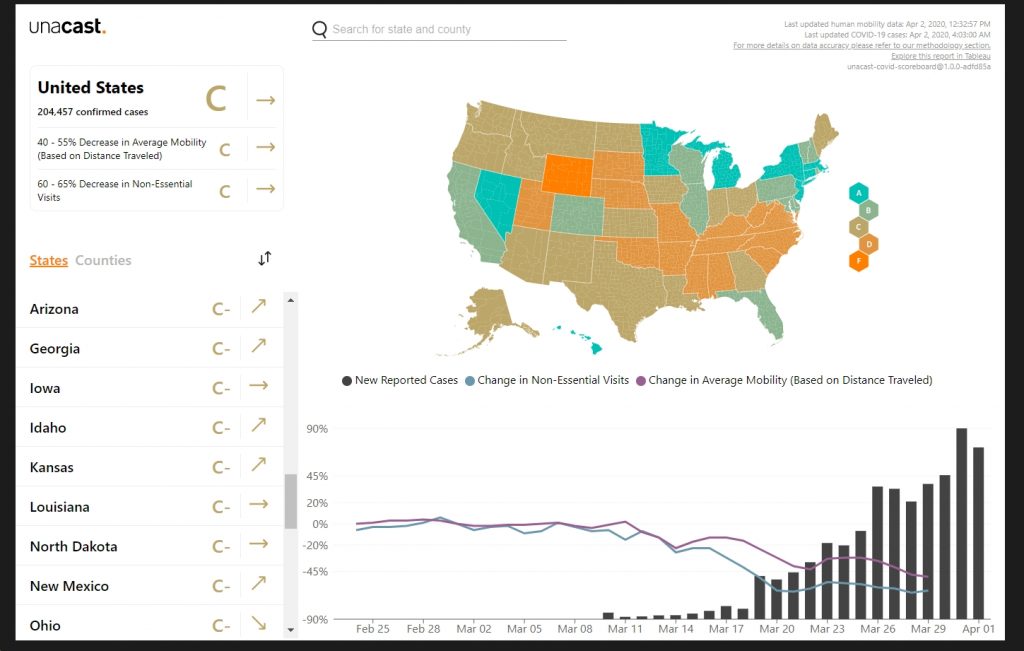
Then, there are a bunch of states getting “C” or “C-” grades. As you can see, we’re now getting into “red” America – AK, IN, TX, MT, GA, IA, ID, KS, LA, ND, OH – plus ME, OR and AZ. (note: for whatever reason, OH Gov. Mike DeWine has received strong reviews for his performance during this crisis, yet OH gets a pitiful “C-” grade on this scorecard)
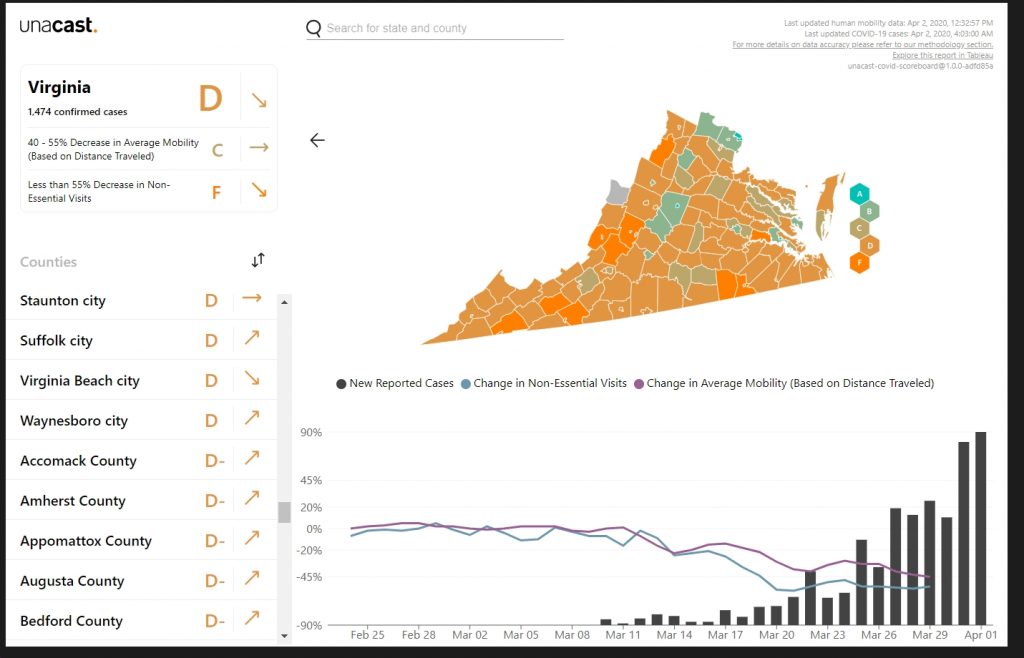
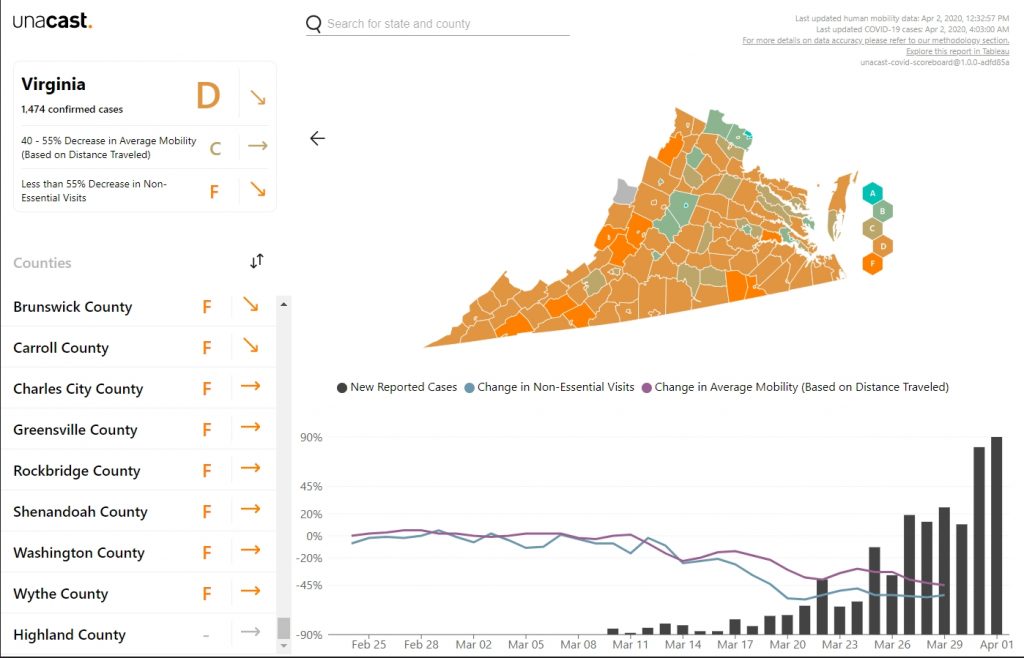
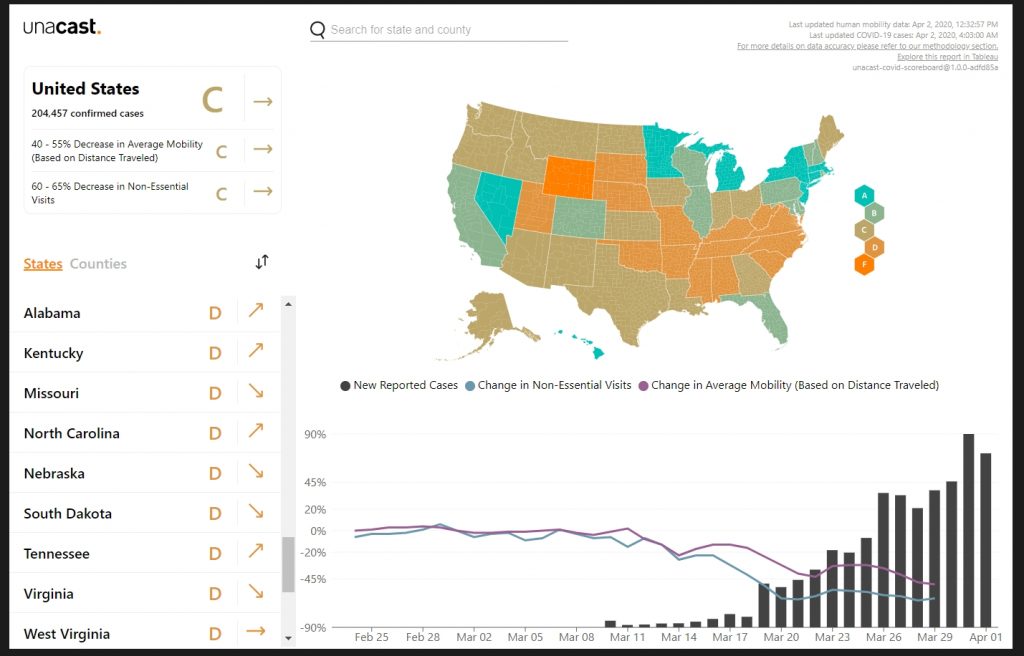
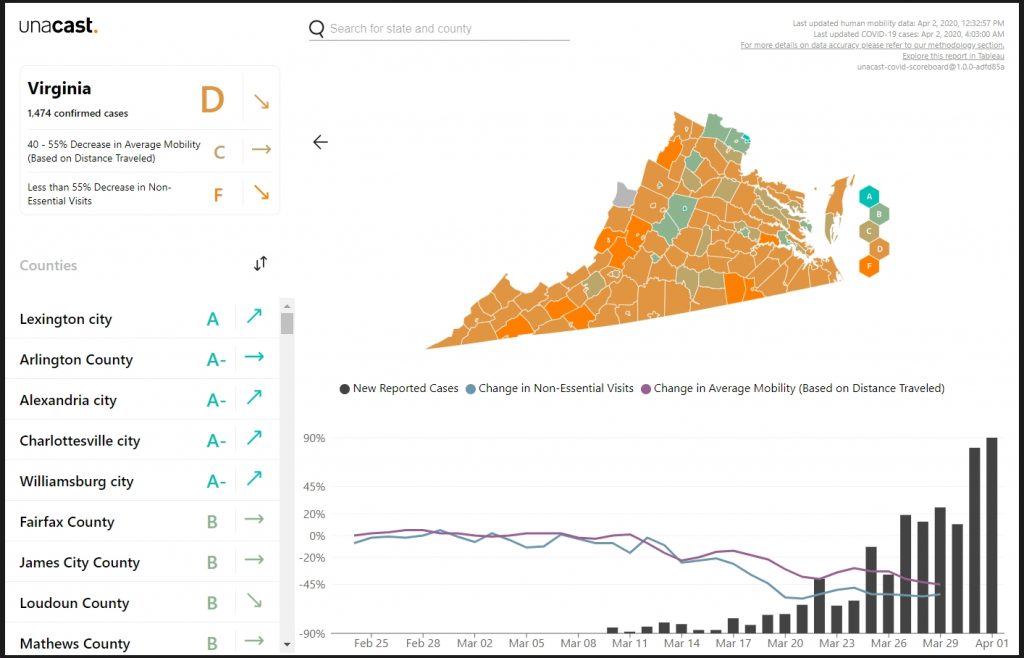
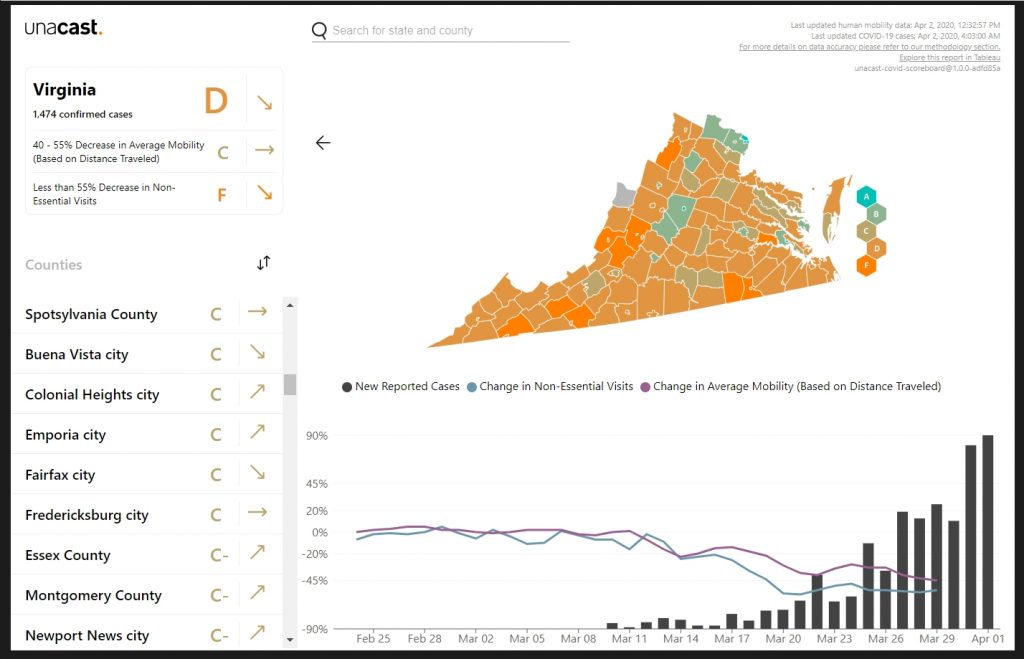
Finally…last but, yeah, least…are the “D” and “F” grade states. Note that these are all “red” states (AL, KY, MO, NC, NE, SD, TN, WV, AR, MS, OK, SC, UT, WY), with one glaring exception – that’s right, “blue” Virginia, with a “D” grade. What on earth is going on here? See below for a breakdown of Virginia by county to see who’s doing really well (only a handful, mostly deep-“blue”), who’s mediocre (a bunch) and who’s doing really badly (a slew of counties, overwhelmingly “red” areas).
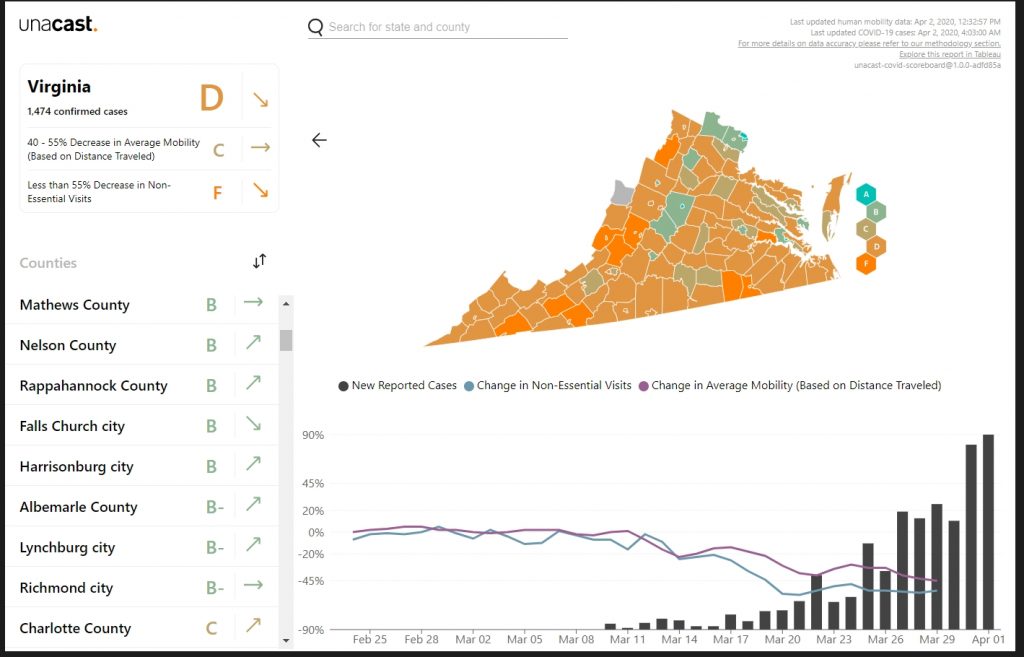
So…here’s Virginia by jurisdiction (county or city), ranked from “A” to “F” grades. At the top are strongly “blue” areas: Lexington City (A), Arlington County (A-), Alexandria (A-), Charlottesville (A-), Williamsburg (A-). Then we get into the “B” grades Fairfax County, James City County, Loudoun County, Mathews County, Nelson County, Rappahannock County, Falls Church, Harrisonburg, Albemarle County, Lynchburg, Richmond City – most of which are “blue” areas. Note that only one five Virginia jurisdictions receive “A” or “A-” grades, and that only 11 Virginia jurisdictions receive “B” or “B-” grades. Not good.
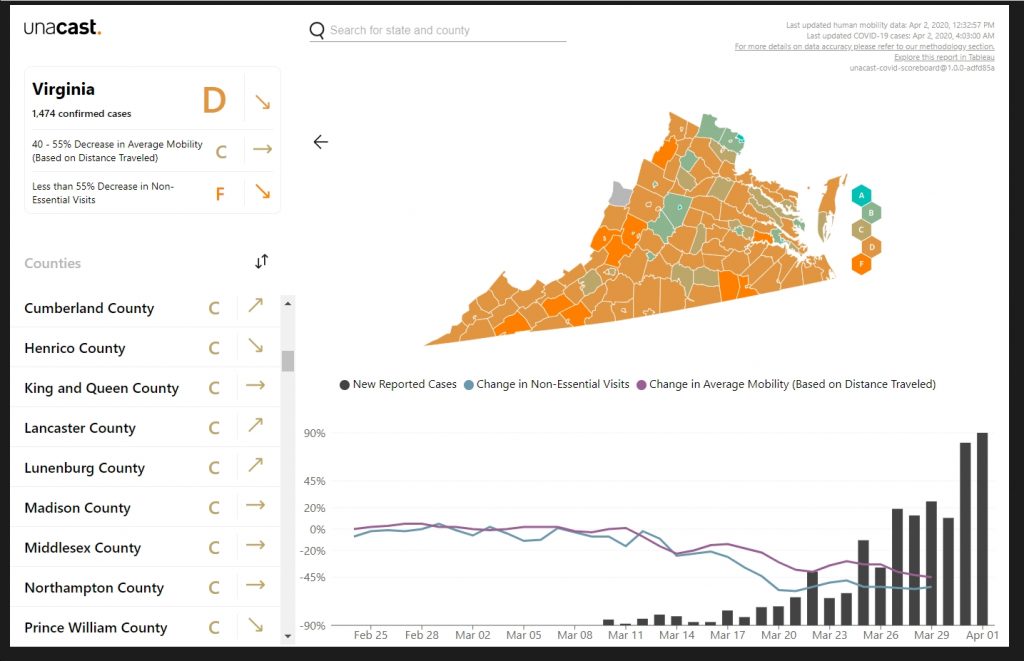
The “C” jurisdictions – and there are a lot of them – are a mix of “blue,” “purple” and “red” areas, including Henrico County, Prince William County, Spotsylavnia County, Fairfax City, Roanoke City, Newport News and Winchester.
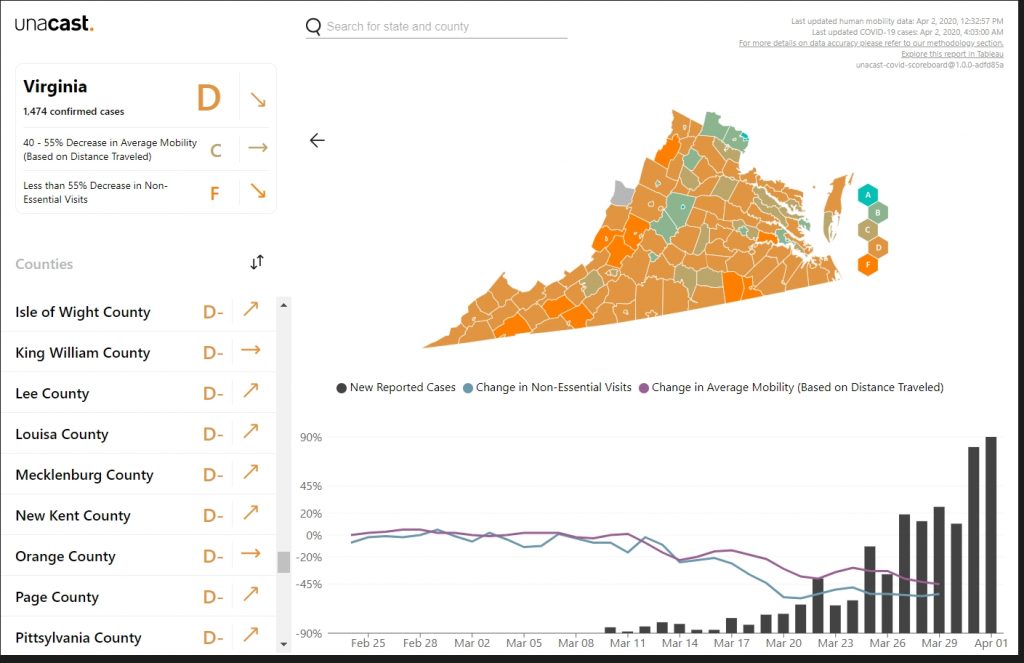
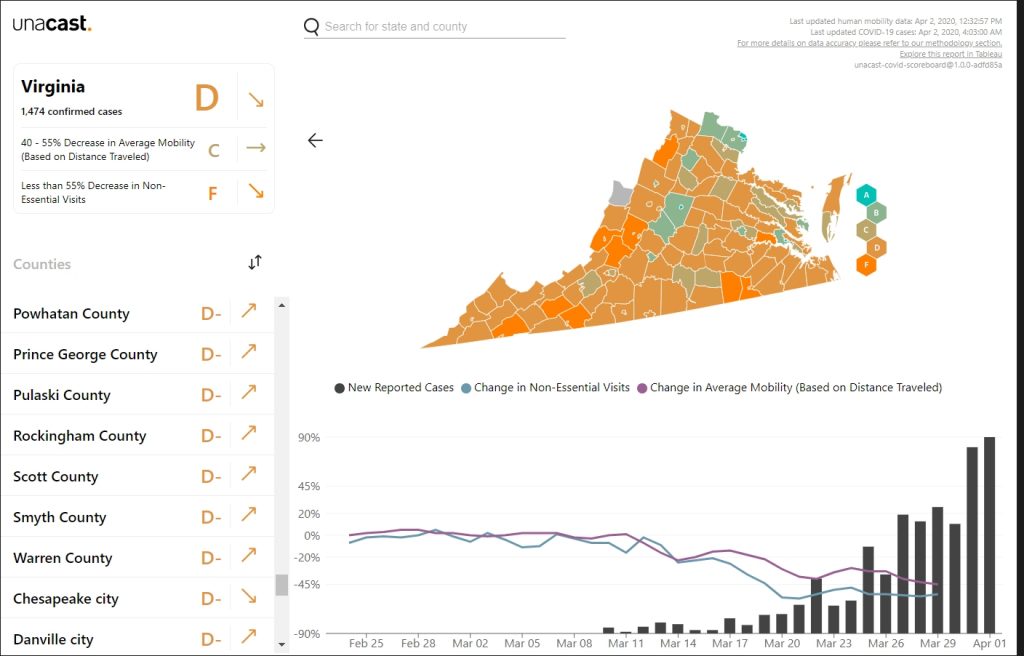
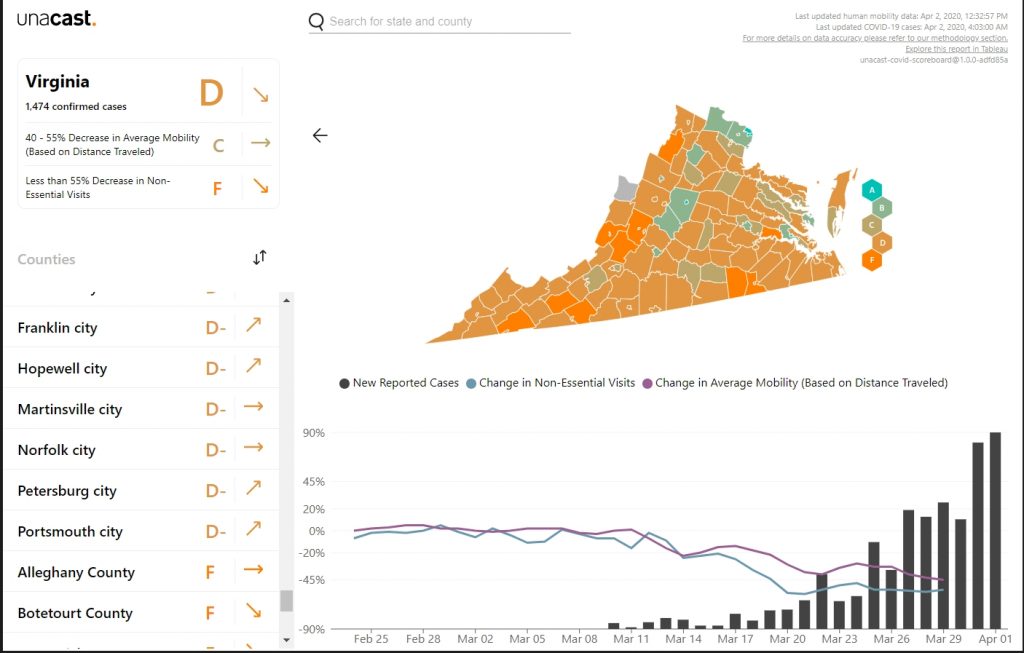
Finally, we have a looong list of areas with “D” and even “F” scores. The vast majority of these are deep-“red” areas (e.g., Shenandoah, Wythe, Washington, Rockbridge…), with a few exceptions like Chesapeake and Norfolk. In sum, vast swaths of Virginia are in the “C”/”D”/”F”-grade ranges, with a few pockets of “A” and “B”-grade areas, mostly in deep-“blue” places like Arlington, Alexandria, Charlottesville, Fairfax County, Loudoun County, Albemarle County, Richmond City, etc. Of course, what we need is for *every* jurisdiction in Virginia to get to an “A,” or at least into the “B” range, ASAP. How do we make this happen? Does Gov. Northam need to toughen up even more? Other ideas?