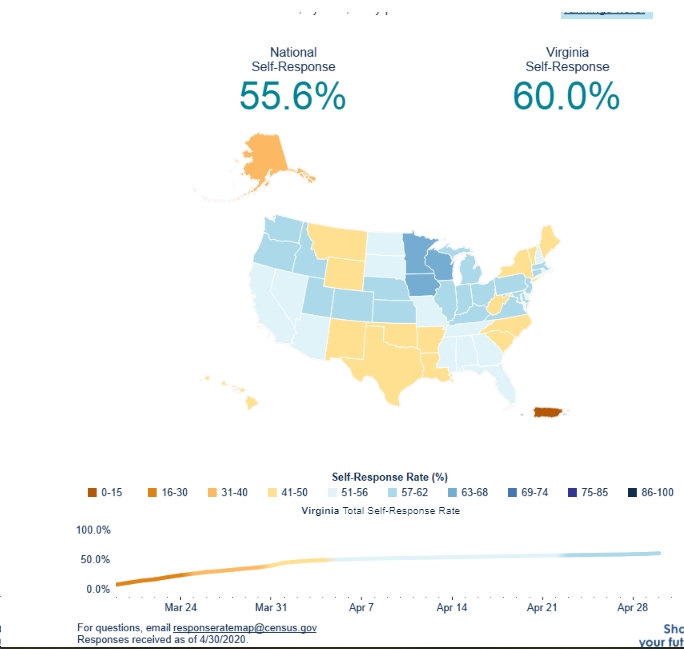
With the 2020 Census well underway – and with the response rate running ahead of expectations, in part because people are stuck at home during the COVID 19 pandemic – how is Virginia doing relative to other states, and how are specific jurisdictions within Virginia doing? See here for the rankings – the national self-response rate is at 55.6% and Virginia’s self-response rate at 60.0%, ranking us 12th-best in the nation.
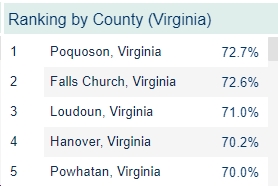
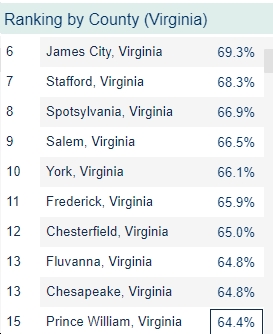
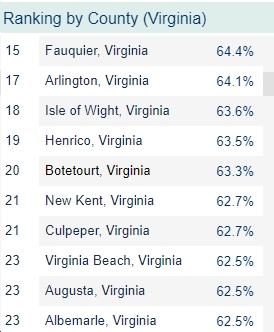
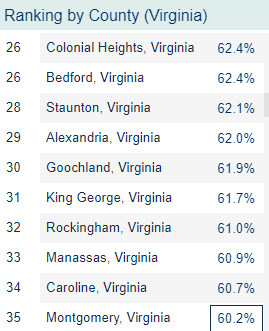
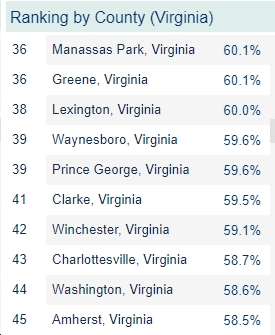
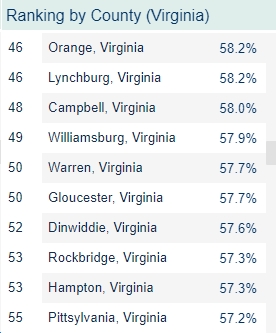
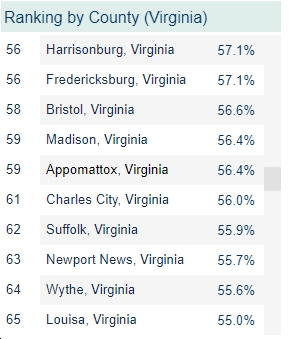
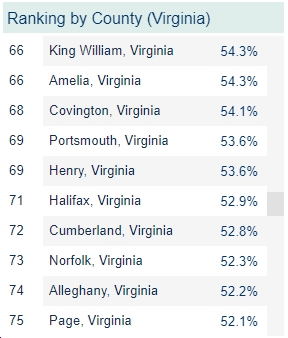
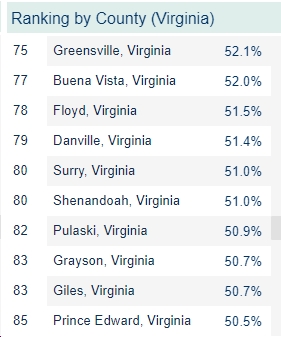
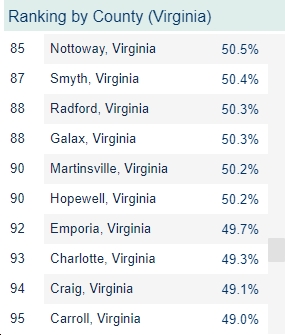
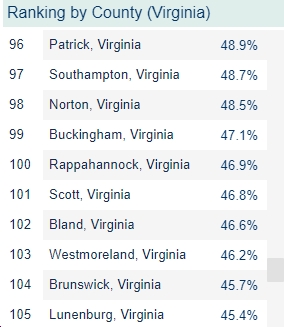
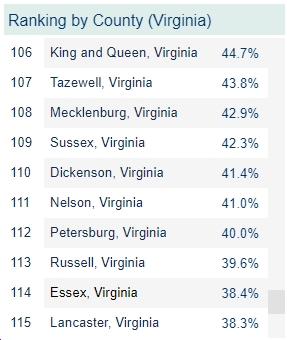
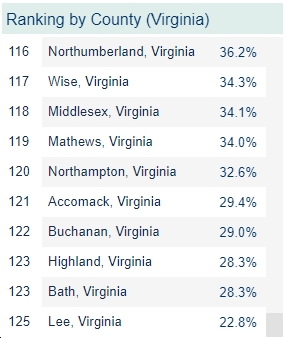
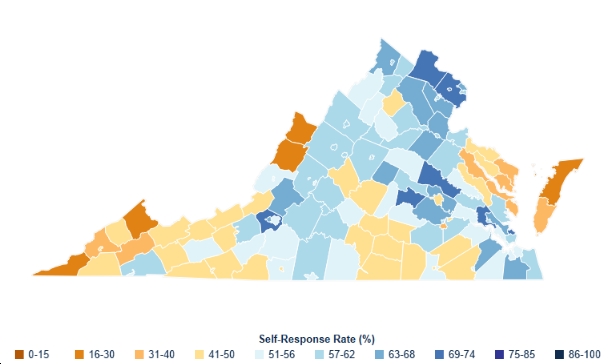
As for how we’re doing by specific jurisdiction, here are Virginia’s jurisdictions, from best to worst response rates, from Poquoson County (72.7%), Falls Church (72.6%), Loudoun County (71.0%), Fairfax County (70.3%), Hanover County (70.2%) and Powhatan County (70.0%) down to Accomack County (29.4%), Buchanan County (29.0%), Highland County (28.3%), Bath County (28.3%) and Lee County (22.8%). Some other big Virginia jurisdictions’ response rates include: Stafford County (68.3%), Spotsylvania County (66.9%), Chesterfield County (65.0%), Prince William County (64.4%), Arlington County (64.1%), Henrico County (63.5%), Virginia Beach (62.5%), Albemarle County (62.5%), Alexandria (62.0%), Charlottesville (58.7%), Lynchburg (58.2%), Harrisonburg (57.1%), Fredericksburg (57.1%), Newport News (55.7%), Roanoke City (53.4%), Norfolk (52.3%), Richmond City (50.9%), and Petersburg (40.0%).
Remember, it’s important to be counted for a bunch of reasons, including “an impact on planning and funding for health clinics and highways, fire departments and disaster response, education programs such as Head Start and college tuition assistance, and so much more.” So fill out your form – it’s easy and only takes a few minutes.






![[UPDATED 1/29/26] Audio: Sen. Tim Kaine Talks to Blue Virginia About His “Five-Point Plan” to Fight Trump’s Orban-Like Assault on US Democracy; Civil Disobedience a la MLK Jr.; Trump’s Bogus “Energy Emergency”; the Crucial Importance of the 2025 VA Elections; etc.](https://bluevirginia.us/wp-content/uploads/2025/02/kaineinterview2-100x75.jpg)

