PRRI is out with its 2020 Census of American Religion, which finds that ” seven in ten Americans (70%) identify as Christian, including more than four in ten who identify as white Christian and more than one-quarter who identify as Christian of color. Nearly one in four Americans (23%) are religiously unaffiliated, and 5% identify with non-Christian religions.” The census further finds:
“Over the last few decades, the proportion of the U.S. population that is white Christian has declined by nearly one-third. As recently as 1996, almost two-thirds of Americans (65%) identified as white and Christian. By 2006, that had declined to 54%, and by 2017 it was down to 43%[4]. The proportion of white Christians hit a low point in 2018, at 42%, and rebounded slightly in 2019 and 2020, to 44%. That tick upward indicates the decline is slowing from its pace of losing roughly 11% per decade.”
In terms of U.S. politics, the census finds that:
- “White Christians tilt Republican: 39% identify as Republican, 31% identify as Democrat, and 28% identify as independent.”
- “White mainline Protestants are politically mixed: 33% identify as Republican, 35% identify as Democrat, and 30% identify as independent.”
- “White Catholics are skew slightly toward the Democratic side: 38% identify as Democrat, 32% identify as Republican, and 28% identify as independent.”
- “Black Protestants are overwhelmingly Democratic: 65% identify as Democrat, 7% identify as Republican, and 26% identify as independent.”
- “Hispanic Protestants are primarily independent or Democratic: One in five (20%) Hispanic Protestants identify as Republican, 33% identify as Democrat, and 42% identify as independent.”
- “Hispanic Catholics generally identify as Democrats or independents: One in ten Hispanic Catholics identify as Republican (10%), about four in ten identify as Democrat (41%), and about four in ten identify as independent (42%).”
- “Other Christians are primarily independents: 27% identify as Republican, 27% identify as Democrat, and 39% identify as independent.”
- “About one in five (22%) Jewish Americans identify as Republican, 44% identify as Democrat, and about three in ten (31%) identify as independent.”
- “Muslim Americans are predominantly independent or Democrat: 11% of Muslim Americans identify as Republican, 46% identify as Democrat, and 36% identify as independent.”
- “Buddhist Americans are primarily independents or Democrats: 18% of Buddhist Americans identify as Republican, 33% identify as Democrat, and 44% identify as independent.”
- “Hindu Americans are generally independents or Democrats: 11% of Hindu Americans identify as Republican, 35% identify as Democrat, and 44% as independent.”
- “Religiously unaffiliated Americans are primarily independents and Democrats: 16% identify as Republican, 35% identify as Democrat, and 46% identify as independent.”
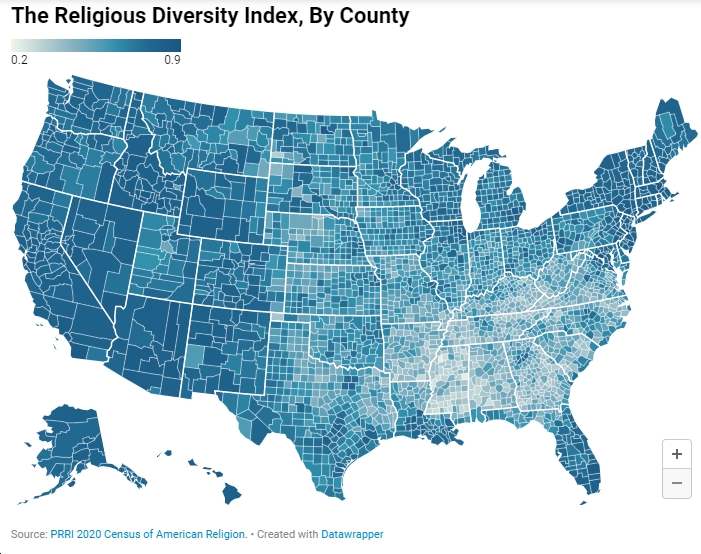
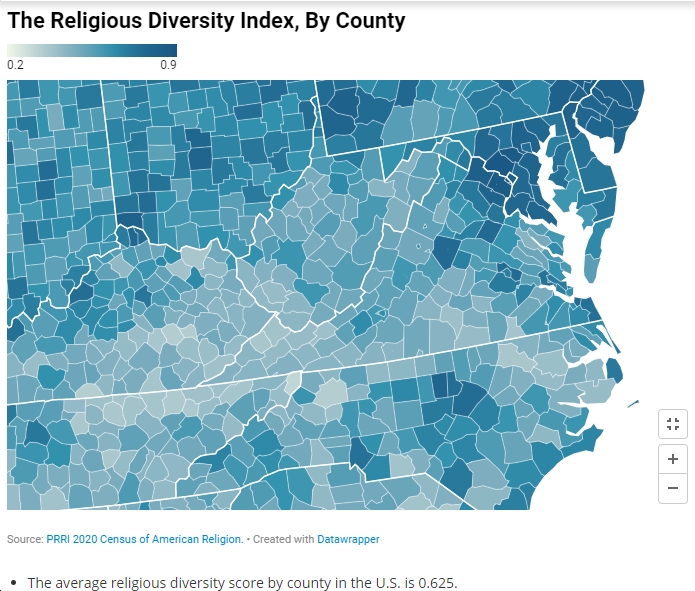
Interesting stuff. PRRI also looks at religious diversity at the county level, where “a score of 1 signifies complete diversity—every religious group is of equal size—and a score of 0 indicates a complete lack of diversity and one religious group comprises the entire population of a given county.” What the census finds is that the “average religious diversity score by county in the U.S. is 0.625,” with diversity highest in urban areas and “lowest in the southern part of the U.S. and in rural areas.”
So how about Virginia? Here are some county-level diversity numbers, from high to low; keep in mind that the average for the U.S. is 0.625. Also note which ones are “blue,” which are “red” and which are “purple” politically; as you can see, there’s a pretty strong – but not perfect – correlation between the religious diversity level of a county/city and the political lean, with generally speaking higher religious diversity correlating with “bluer” areas politically, and lower religious diversity correlating with “redder” areas politically.
- Fairfax County: 0.861
- Arlington County: 0.859
- Alexandria: 0.833
- Loudoun County: 0.823
- Prince William County: 0.793
- Fredericksburg: 0.766
- Charlottesville: 0.762
- Albemarle County: 0.753
- Norfolk: 0.752
- Spotsylvania County: 0.752
- Henrico County: 0.751
- Virginia Beach: 0.731
- James City County: 0.722
- Stafford County: 0.716
- Fauquier County: 0.706
- York County: 0.699
- Chesterfield County: 0.695
- Richmond City: 0.685
- Newport News: 0.682
- Fluvanna County: 0.677
- Orange County: 0.677
- Montgomery County: 0.64
- Roanoke City: 0.629
- Essex County: 0.447
- Wise County: 0.441
- Carroll County: 0.441
- Russell County: 0.419
- Mecklenburg County: 0.412
- Tazewell County: 0.41
- Charlotte County: 0.398
- Bland County: 0.395
- Buchanan County: 0.382
- Greensville County: 0.38
- Dickenson County: 0.368