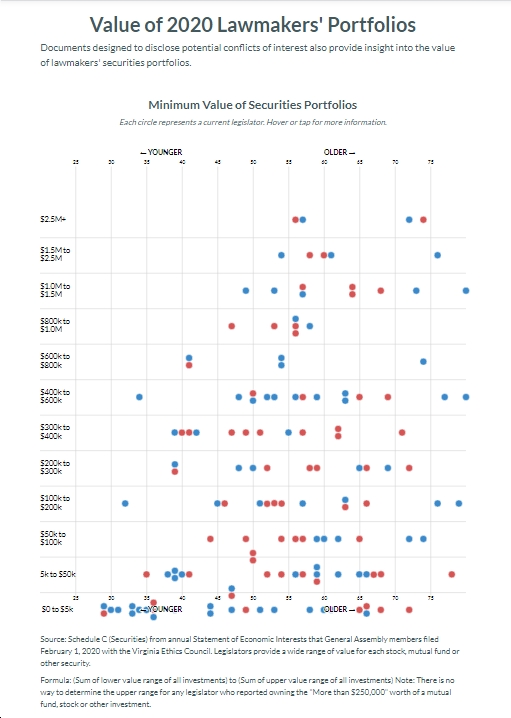
See below for a graphis, courtesy of VPAP, on the value of Virginia legislators’ securities portfolios. Given how often we hear that there’s an inverse relationship between wealth and progressivism, I thought it might be interesting to compare these portfolio numbers to legislators’ 2020 VAPLAN progressive scores to see if there’s any correlation. Here’s what jumped out at me from these numbers.
- Among Virginia General Assembly Republicans, it looks like 8 have portfolios between $0 and $5k; 10 are in the $5k-$50k range; 8 are in the $50-$100k range; 6 are in the $100k-$200k range; 6 are in the $200k-$300k range; 9 are in the $300k-$400k range; 4 are in the $400k-$600k range; 1 is in the $600k-$800k range; 4 are in the $800k-$1.0 million range; 4 are in the $1.0-$1.5 million range; 2 are in the $1.5-$2.5 million range; 2 are in the $2.5+ million range.
- Among Virginia General Assembly Democrats, it breaks out as: 17 between $0 and $5k; 11 between $5k and $50k; 5 between $50k and $100k; 7 between $100k and $200k; 5 between $200k and $300k; 3 between $300k and $400k; 11 between $400k and $600k; 4 between $600k and $800k; 2 between $800k and $1 million; 5 between $1.0 and $1.5 million; 3 between $1.5 and $2.5 million; 2 greater than $2.5 million.
- The legislators with the largest stock portfolios are: Sen. Bill DeSteph ($6.8+ million); Del. Rodney Willett ($4+ million); Del. Kathleen Murphy ($3.1+ million); Senate Minority Leader Tommy Norment ($2.7+ million); Sen. Mark Obenshain ($2.4+ million); Sen. Janet Howell ($2.1+ million); Del. Rip Sullivan ($2+ million); Sen. Ben Chafin ($1.8+ million); Del. Mark Levine ($1.7+ million); Del. Kaye Kory ($1.5+ million); Senate Majority Leader Dick Saslaw ($1.4+ million); Sen. Scott Surovell ($1.4+ million); Del. Joe McNamara ($1.4+ million); Del. Dave LaRock ($1.2+ million); Sen. Monty Mason ($1.2+ million); Del. Danny Marshall ($1.1+ million); Sen. John Bell ($1.1+ million); Del. Roxann Robinson ($1-$6.3 million); Sen. Todd Pillion ($1+ million); Speaker Eileen Filler-Corn ($930k+); Sen. Steve Newman ($910k+); Sen. Siobhan Dunnavant ($860k+); Del. David Reid ($860k+); Sen. Bill Stanley ($850k+)…
- The legislators with the smallest stock portfolios are: Del. Ibraheem Samirah ($0); Del. Will Wampler ($0); Del. Joshua Cole ($0); Del. Jay Jones ($0); Del. Lee Carter ($0); Del. Chris Hurst ($0); Del. Lashrecse Aird ($0); Del. Danica Roem ($0); Del. Emily Brewer ($0); Del. Lamont Bagby ($0); Del. Jeff Bourne ($0); Del. Elizabeth Guzman ($0); Del. Chris Collins ($0); Del. Charniele Herring ($0); Del. Cliff Hayes ($0); Del. Clint Jenkins ($0); Del. Steve Heretick ($0); Del. Bobby Orrock ($0); Del. Barry Knight ($0); Del. Jeion Ward ($0); Del. Wendell Walker ($0); Sen. Emmett Hanger ($0)…
- So how do the poorest Democrats stack up in terms of VAPLAN progressive scores? Are the ones with the least wealth the most progressive, or does it not really correlate at all? Let’s check it out. Del. Josh Cole – 6th most progressive delegate (out of 55 House Dems); Del. Jay Jones – 7th most progressive delegate; Del. Lee Carter – 32nd most progressive delegate; Del. Chris Hurst – 44th most progressive delegate; Del. Lashrecse Aird – 8th most progressive delegate; Del. Danica Roem – 29th most progressive delegate;Del. Lamont Bagby – 14th most progressive delegate;Del. Jeff Bourne – 12th most progressive delegate; Del. Elizabeth Guzman – 10th most progressive delegate;Del. Charniele Herring – 19th most progressive delegate; Del. Cliff Hayes – 45th most progressive delegate; Del. Clint Jenkins – 40th most progressive delegate; Del. Steve Heretick – 53rd most progressive delegate; Del. Jeion Ward – 18th most progressive delegate. Are you seeing any pattern here? As far as I can tell, the poorest Democrats are kinda average for their 55-member caucus, ranging from 6th-most progressive to 53rd-most progressive, and mostly in between.
- How about the wealthiest Democrats? Are they less progressive than other Democrats? Well…maybe not. Del. Rodney Willett – 20th most progressive delegate (out of 55 Democratic delegates); Del. Kathleen Murphy – 22nd most progressive delegate; Sen. Janet Howell – 18th most progressive Senator (out of 21 Senate Dems); Del. Rip Sullivan – 28th most progressive delegate; Del. Mark Levine – 5th most progressive delegate); Del. Kaye Kory – 27th most progressive delegate; Senate Majority Leader Dick Saslaw – 16th most progressive Senate Dem; Sen. Scott Surovell – 6th most progressive Senate Dem; Sen. Monty Mason – 12th most progressive Senate Dem; Sen. John Bell – 19th most progressive Senate Dem; Speaker Eileen Filler-Corn – 26th most progressive delegate; Del. David Reid – 47th most progressive delegate. Again, it’s hard to see much correlation here between wealth and voting record.
- A few more examples: Del. Patrick Hope, the most progressive member of the House of Delegates, is in the upper-middle in terms of stock portfolios, with $410k+; Del. Marcus Simon, the third-most progressive member of the House of Delegates, has $530k-$3.3 million, putting him in the top tier in terms of wealth; Del. Don Scott, the fourth-most progressive delegate, has a solid $320k+ in stock holdings; etc. Oh, and one of the least-progressive Democrats in the General Assembly, Sen. Lynwood Lewis, is towards the bottom in terms of stock holdings ($25k-$250k).
- Bottom line: There appears to be no positive correlation between Virginia General Assembly members’ stock portfolios and their progressive voting scores. This is particularly the case in the House of Delegates, but you also see it in the State Senate. And as for Republicans, again, I’m not seeing any strong correlation. Of course, this is only looking at stock portfolios, not at political contributions, so it doesn’t disprove the thesis that money influences people’s voting records. But at least based on stock portfolios, there’s nothing obvious jumping out here…


