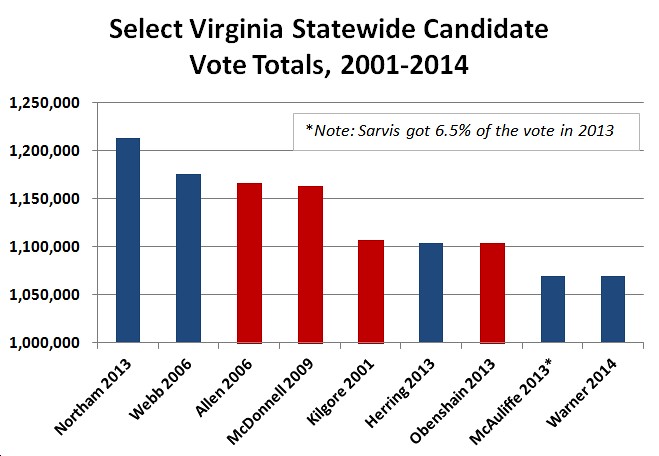

The following are selected vote totals from non-presidential-election-year, statewide races in Virginia since 2001. Obviously, the state’s population has grown a great deal since 2001 (e.g., 4.1 million registered voters in 2001, 5.4 million registered voters in 2012), so all else being equal, one would assume that the winning candidate would get more votes than they would have 13 years ago. Which makes it all the more striking that Mark Warner’s campaign in 2014 managed to get just 1,069,451 votes in, essentially, a two-way race (Robert Sarvis got just 53,201 votes). That’s lower than Terry McAuliffe got last year in a three-way race (in which Roberts Sarvis got 6.5% of the vote), lower than Jim Webb in the mid-term election of 2006 (Webb got 1,175,606 votes that year), also lower than George Allen in 2006 (he got 1,166,277), lower than Mark Herring in 2013 (Herring got 1,103,777, edging Mark Obenshain by just 165 votes), etc. What do I make of this? In short, it appears that Democratic voters were less motivated to turn out this Tuesday for Mark Warner than they were for McAuliffe/Northam/Herring last year and for Jim Webb in 2006. Why? That’s a question I’m throwing out there, but it’s hard for me to see how Warner worked to motivate the “base” (and remember, these mid-terms are “base elections”) to turn out. Your thoughts?