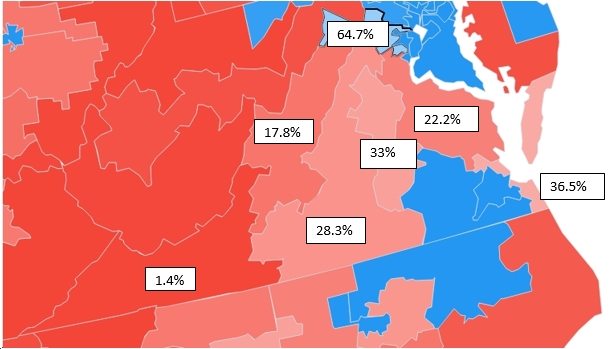
Courtesy of The Crosstab blog, here’s a map with the current, estimated percentage chances of Democrats winning each district. Note that I’ve left off Democratic-controlled VA-03, VA-04, VA-08 and VA-11, as they’re all 99% likely to remain Democratic. Of course, these percentages could change dramatically by November, depending on national political trends, the strength of candidates and campaigns, and other variables. I’m hoping they go up, of course, as Trump’s numbers hopefully head back down again (after a small but noticeable uptick, for whatever crazy reason, the past few weeks). As of right now, I’d probably go with closer to 80% (vs. 64.7%) in VA-10, 40% (vs. 36.5%) in VA-02, 35% (vs. 33%) in VA-07, 20% (vs. 28.3%) in VA-05, 15% (vs. 22.2%) in VA-01, 10% (vs. 17.8%) in VA-06 and 1% (vs. 1%) in VA-09. What do you think?


![Video: Former Eastern District of VA Federal Prosecutor Gene Rossi Asks, “Is Donald Trump going to be the lead counsel in that prosecution [of Jim Comey] and do the opening, closing and rebuttal? I pray that he does!”](https://bluevirginia.us/wp-content/uploads/2025/09/rossiedva-238x178.jpg)


![Saturday News: “Trump’s latest tariff TACO probably won’t make your life more affordable”; “The Epstein Email Cache: 2,300 Messages, Many of Which Mention Trump”; “[MTG] questions if Trump is still the ‘America First’ president”; “Jim Ryan tells all: ‘What did the Governor know, when did he know it?’”](https://bluevirginia.us/wp-content/uploads/2025/11/montage1115-100x75.jpg)
