Over at “Virginia’s Conservative Voice,” Bearing Drift, Stephen Spiker has an excellent analysis on “How Vulnerable are Northam-won GOP Districts?” I definitely recommend everyone check it out.
The bottom line is clear: “Turnout is the $64,000 question for 2019. We know that turnout for an off-off cycle will be lower. What we don’t know is how low, and more importantly, who will that help?” For instance, “if lower turnout in 2019 provides even just half the advantage it provided Republicans from 2013 to 2015, then Republicans increase their advantage in the House.”
Of course, as Spiker correctly notes, “There are a dozen different ways you can crunch these numbers, and a dozen different reasons why this analysis is surface-level.” Still, voter turnout is an enormously important variable, one I’d argue is FAR more important than gerrymandered districts (don’t believe that? check out the House of Delegates results from the lackluster 2013 gubernatorial election year, when Democrats gained no seats at all, and compare to the huge “blue wave” of the 2017 gubernatorial election year, when Democrats gained 15 seats…and note that both of those elections occurred under the same House of Delegates district lines, so the main thing that changed was turnout).
Anyway, the Bearing Drift piece motivated me to gather some voter turnout numbers from several of Virginia’s most populous cities and counties. I might add more later, but this is a VERY time-consuming process, as it’s not “one-stop shopping” on the State Board of Elections website for this data. Instead, one has to look at individual jurisdictions’ election websites, and those are not always complete. So anyway, a few hours of work led to the following graphics and writeup. See below each graphic for a few highlights that jumped out at me.
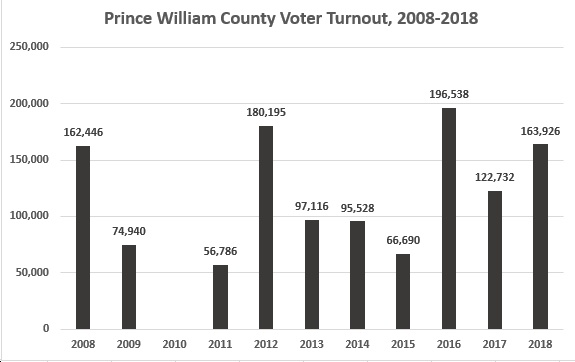
- The fluctuations in Prince William County’s voter turnout between presidential election years (2008, 2012, 2016) and the “off-odd” election year (2011, 2015, and now 2019) have been extreme – and the election results most definitely have reflected that!
- For instance, in 2008, there was big turnout (162k), with Barack Obama winning the county big over John McCain (93k-68k). Yet the very next year, turnout plummeted (to just 75k) in the gubernatorial election year, with Republican Bob McDonnell crushing Democrat Creigh Deeds (44k-31k) in the exact same county that just voted strongly for Barack Obama a year earlier. Of course, when Democratic turnout falls by two-thirds, from 93k to 31k, while Republican turnout “only” falls by about one-third, from 68k to 44k, you can see the results…a solidly “blue” county one year turns solidly “red” the next.
- Check out 2011 and 2012 for another stark example of this phenomenon. In 2011, voter turnout was absolutely abysmal – just 57k – and Democratic turnout was beyond abysmal, at just 15k. The result? Hard-line Republican Corey Stewart won reelection by a wide margin (33k-15k) over Democrat Babur Lateef, and the county looked solid-“red” again. But hold on one minute…or actually, one year, because in 2012, the presidential election saw HUGE turnout (180k), with Barack Obama crushing Mitt Romney (103k-74k) in the same county that, the previous November, had reelected neo-Confederate Corey Stewart. That’s basically all the result of turnout – or, more to the point, lack thereof, particularly among Democratic voters.
- As you can see in the 2016-2018 elections, when Prince William County voters show up at the polls in large numbers, Democrats win – overwhelmingly! Thus, in 2016, Hillary Clinton beat Donald Trump 113k-72k; in 2017, Ralph Northam defeated Ed Gillespie 75k-46k; and in 2018, Tim Kaine demolished (106k-54k) the same Corey Stewart who has kept winning reelection as PW County Board Chair, election after election. Again, that is mostly the result of turnout, although of course it’s also important to point out that the county’s getting more diverse and Democratic every year that goes by.
- Still, we can’t assume that Democrats will automatically win in Prince William County; if they show up, then we should win, but if not, we very well could lose. And that could impact not just the County Board Chair race, but also the Commonwealth’s Attorney race, the Sheriff’s race, the magisterial district races, and several key legislative races (e.g., Democrat Dan Helmer vs. Republican Del. Tim Hugo in HD40; Del. Hala Ayala vs. Republican Rich Anderson in HD51; Del. Lee Carter vs. Republican Ian Lovejoy in HD50; Del. Danica Roem vs. Republican Kelly McGinn in HD13; Democrat John Bell vs. Republican Geary Higgins in SD13).
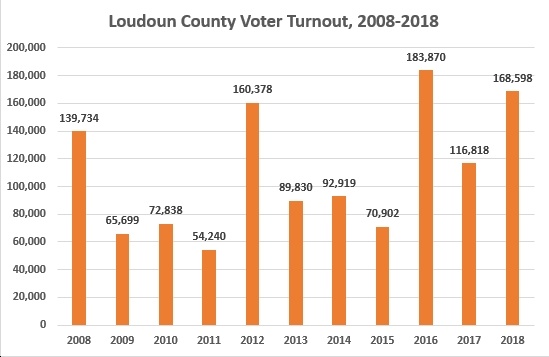
- We see a similar, pronounced voter turnout fluctuation in Loudoun County, with much the same impact on results.
- For instance, in 2008, Barack Obama won Loudoun County (75k-63k), with 140k voters coming out to the polls. But then in 2009, Loudoun County voter turnout plummeted to just 66k, and Republican Bob McDonnell crushed Democrat Creigh Deed (40k-25k) for governor. Note that the Democratic vote fell from 75k in 2008 to just 25k in 2009 — again, a drop of two thirds, just like in Prince William County between 2008 and 2009. Meanwhile, the Republican vote fell, but again, only by about one-third, from 63k to 40k. So yeah, I think we can pretty much conclude that Republican turnout’s been relatively steadier than Democratic turnout, because for whatever reasons, Republican voters in places like Loudoun County and Prince William County have a higher propensity to vote in all elections than do Democratic voters. And that could potentially be a big problem in 2019.
- Note that in 2015, voter turnout was abysmally low (71k), yet Democrat Phyllis Randall won the County Board Chair race. How did she do that? In large part, because two opponents – Republican Charles King and Independent Scott York, who had been a Republican for years – split the Republican vote, allowing Randall to win with 37.5% of the vote.
- In 2016-2018, turnout was high for the presidential election, then for the first and second elections with Trump in the White House (the 2017 gubernatorial and 2018 mid-terms), with Democrats romping both times — Northam 70k-Gillespie 46k in 2017; Tim Kaine 106k-Corey Stewart 58k in 2018.
- Looking at the entire 2008-2018 period, Loudoun County voter turnout fluctuated from as high as 78% in 2009 to as law as 33% in 2015, the last “off/odd” election year. not to belabor the point, but how high that percentage will end up being in 100 days is absolutely crucial to the results we see on election night, November 5.
- The question is, again, what will turnout look like in 2019? Will it revert back more to the historic pattern, or will it stay strong in the anti-Trump backlash era, even for an election with no “statewides” on the ballot? We’re going to find out in 100 days, with turnout the key variable, IMHO. If turnout’s high, it’s quite possible that not only will Phyllis Randall win reelection (over our old pal, former Virginia Republican Chair John “Anti-Semitic Joke Dude” Whitbeck), but that Democrats will also win the Commonwealth’s Attorney race (Democratic nominee Buta Biberaj), the Sheriff’s race (Democratic nominee Justin Hannah), and some key legislative races (Democrat John Bell in SD13; Democrat Wendy Gooditis in HD10…).
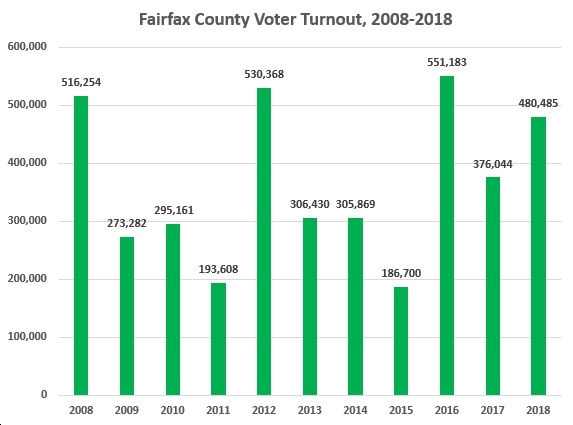
- The wild fluctuations in voter turnout we saw in Prince William County and Loudoun County have also occurred in Fairfax County, with turnout hitting a high of 551k in the 2016 presidential election, and a low of just 187k in the last “off/odd” election year of 2015.
- In percentage terms, that translates into 83% turnout in 2016 vs. just 30% turnout in 2015. In 2017 and 2018, turnout was 56% and 70%, respectively, which is very strong for gubernatorial and mid-term election years. My guess is that it’s the anti-Trump effect, with the big question whether this continues in the “off/odd” election year or not.
- For the most part, Democrats have dominated Fairfax County, given its strong “blue” lean, but still, the level of Democratic turnout has impacted – and will likely impact this November – Board of Supervisor races, School Board races, House of Delegates and State Senate races, etc. This year, a key race that could be impacted significantly by voter turnout is the HD40 slugfest between Democrat Dan Helmer and Republican incumbent Tim Hugo. Clearly, Helmer needs high turnout to beat Hugo, while Hugo would love to see turnout low. Let’s make sure, of course, that Hugo doesn’t get his way, that turnout is super strong, and that Helmer’s the next delegate from HD40!
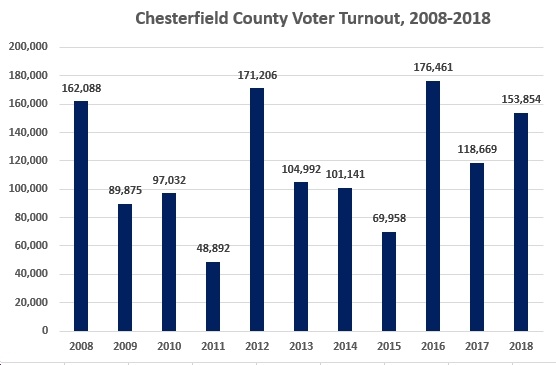
- Chesterfield County is fascinating politically speaking: solidly Republican in 2008 (McCain 86k-Obama 74k), 2009 (McDonnell 60k-Deeds 30k), 2012 (Romney 91k-Obama 78k), 2013 (Cuccinelli 51k-McAuliffe 43k), 2014 (Gillespie 53k-Warner 44k), and even 2016 (Trump 85k-Clinton 81k), but it’s been trending less red for years.
- In 2017, Democrats broke through in Chesterfield, with Ralph Northam defeating Ed Gillespie 59k-58k, as turnout hit an all-time high for a gubernatorial election year.
- Then in 2018, Democrats showed that 2017 wasn’t a fluke, with Tim Kaine beating Corey Stewart handily (83k-68k) in this once solidly red county. Note that turnout in 2018 was very strong, at 154k.
- For Chesterfield County Democrats to have a good election day this November 5, they’re going to need strong turnout again. Key races that could be determined by how high (or low) Democratic turnout ends up being include: Democrat Ghazala Hashmi vs. Republican Sen. Glen Sturtevant in SD10; Democrat Amanda Pohl vs. Republican Sen. Amanda Chase in SD11; Democrat Larry Barnett vs. Republican Del. Roxann Robinson in HD27; Democrat Lindsey Dougherty vs. Republican Carrie Coyner in HD62; Democrat Sheila Bynum-Coleman vs. Speaker Kirk Cox in HD66; Democratic Del. Dawn Adams vs. Republican Garrison Coward in HD68; and Democratic Commonwealth’s Attorney nominee Scott Miles.
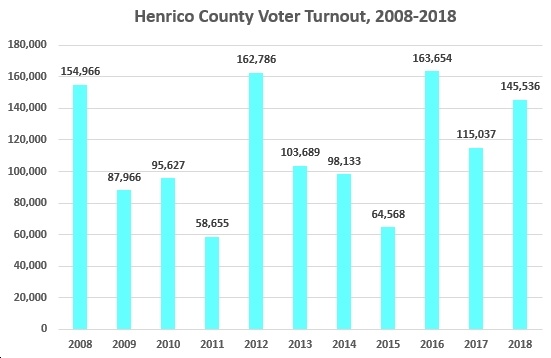
- Henrico County went for Bob McDonnell over Creigh Deeds in 2009, but since then it’s been on a strong “blue streak,” with Obama winning the county easily in 2012; McAuliffe crushing Cuccinelli in 2013; Mark Warner beating Ed Gillespie handily in 2014; Hillary Clinton romping over Donald Trump in 2016; Ralph Northam crushing Ed Gillespie in 2017; Tim Kaine demolishing Corey Stewart in 2018.
- Turnout over those years has ranged from a high of 164k (74%) in 2016 to a low of just 59k (29%) in 2011 and 65k (31%) in 2015. Note that 2011 and 2015 were the last two “off/odd” election years, with no federal or statewide race on the ballot. The question, yet again, is what happens this time around, in an “off/odd” election year but with Trump in the White House.
- The higher turnout, the better, when it comes to Democratic candidates like Debra Rodman in SD12, Del. Schuyler VanValkenburg in HD72, and Rodney Willett in HD73. Note that in 2017, Debra Rodman won HD73 by a narrow, 51%-49% margin over the Republican (John O’Bannon), and that it’s now an open seat, so it could be close. And in SD12, Rodman is taking on incumbent Republican Sen. Siobhan Dunnavant, who won last time around by a 58%-38% margin, but sits in a district won by Ralph Northam (52%-47%) and Tim Kaine (57%-41%). So it’s definitely winnable, but Democrats need to turn out in large numbers to make that happen.
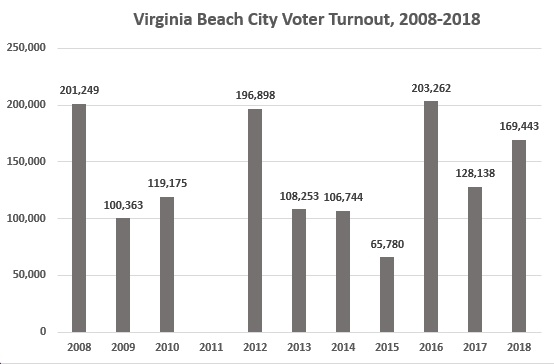
- Virginia Beach was closely divided, but leaning Republican, for many years prior to the 2017 and 2018 elections. For instance, John McCain narrowly (100k-99k) defeated Barack Obama in 2008 in Virginia Beach; Mitt Romney also narrowly (99k-94k) won in 2012; Donald Trump narrowly (98k-91k) won in 2016.
- But then in 2017, Ralph Northam narrowly (66k-60k) defeated Ed Gillespie. And in 2018, Tim Kaine crushed (92k-74k) Corey Stewart. So maybe Virginia Beach is trending “blue” with Trump in the White House?
- Turnout has fluctuated greatly in Virginia Beach, from a high of 203k (66%) in 2013 to a low of just 66k (23%) in 2015 (the last “off/odd” election year). With several key races this November — Cheryl Turpin in SD7, Missy Cotter Smasal in SD8, Del. Kelly Fowler in HD21, Nancy Guy in HD83, Karen Mallard in HD84, Alex Askew in HD85 – Democrats really need to turn out their voters to rack up some wins in this “swing”/”purple” part of Virginia.
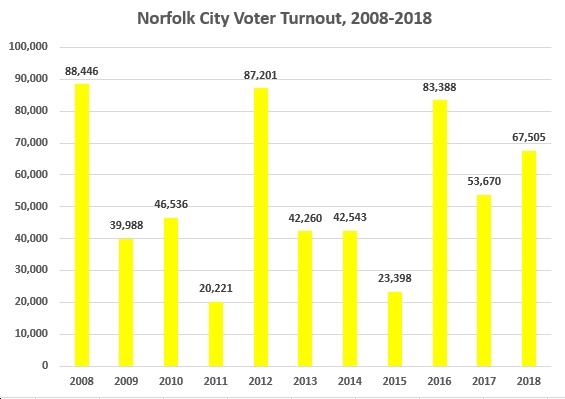
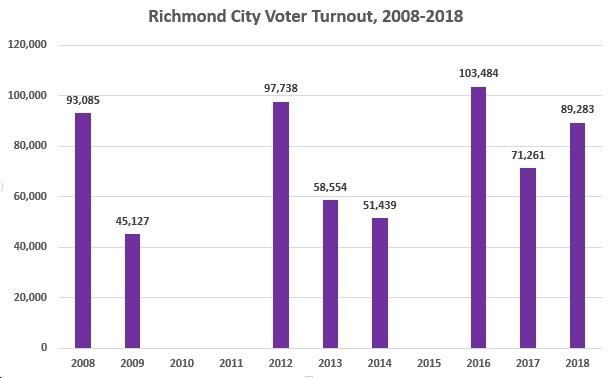
- Finally, the deep-“blue” cities of Norfolk and Richmond are interesting in that they demonstrate how greatly Democratic turnout can fluctuate in different election years. For instance, in Norfolk, turnout has ranged from as low as 20k (17%) in 2011 to as high as 88k (71%) in 2008 and 83k (71%) in 2016. In Richmond, I don’t have complete data, but turnout hit 103k in 2016 compared to just 45k in 2009.
- In Norfolk, some Democratic candidates who could win or lose depending on turnout include: Phil Hernandez in HD100, Nancy Guy in HD83 (although Norfolk’s a very small percentage of HD83, if it’s a close election, it could definitely make the difference), and also Cheryl Turpin in SD7 (again, Norfolk makes up a small but potentially important part of the district).
- In Richmond City, voter turnout could be crucial to Democrats’ chances of winning HD66 (Sheila Bynum-Coleman vs. Speaker Kirk Cox), HD68 (Del. Dawn Adams vs. Republican Garrison Coward), and SD10 (Democrat Ghazala Hashmi vs. Republican Sen. Glen Sturtevant). Democrats really need to maximize turnout in the deep-blue areas (e.g., Richmond City) of these districts, something Democrats didn’t particularly accomplish in 2015.
P.S. On a related note, see Cindy’s excellent article, The Best Thing You Can Do to Defeat Trump in 2020 is to Help Virginia Win in 2019. Also, of course, make sure you donate to Democratic candidates, phone bank, canvass, etc., etc.