by A Siegel
Mobility data analytics firm Unacast has put out an interactive (and being updated) COVID-19 social distancing scorecard assessing the United States on a county-by-county basis. As they explain, “While much is still unknown about COVID-19, it’s clear social distancing is widely agreed to be an effective way of slowing the spread.”
After exploring a number of ways to leverage their databases, they found that the fastest to deploy surrogate for informing decision makers about social distancing measure effectiveness is the change in average distance traveled. On a near real-time basis, they can track changes in mobility patterns. Thus, “using the change in distance traveled from pre-COVID-19 days as a proxy,” they are assessing the extent to which social distancing is occurring.
The metric (while admittedly simple) captures how people adapt their everyday behavior in a few significant areas:
- Switching to home office strongly reduces the daily travel distance.
- Avoiding non-essential trips to entertainment places or spare-time facilities strongly reduces the travel distance.
- Canceling travels and vacations will strongly reduce travel distance.
In brief, Unacast is assessing how the extent of reduction of mobility as a surrogate (indicator) of the effectiveness of social distancing measures.

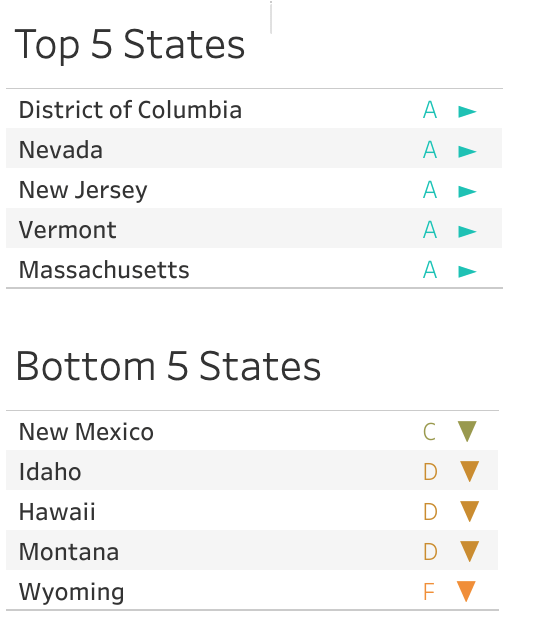
Unacast rates the nation, as of March 22, with a B grade on its scale, with a 40% mobility reduction. Across the nation, DC is graded with an A – the most effective as of the weekend with a 61 percent reduction in mobility (even as, for example, so many Federal offices had yet to move to telecommuting). At the other end, Wyoming comes in with an F, showing only a 6 percent reduction. While far from perfectly correlated, as a state’s political leanings turn redder, their social distancing to flatten the curve (as of this initial report) worsens.
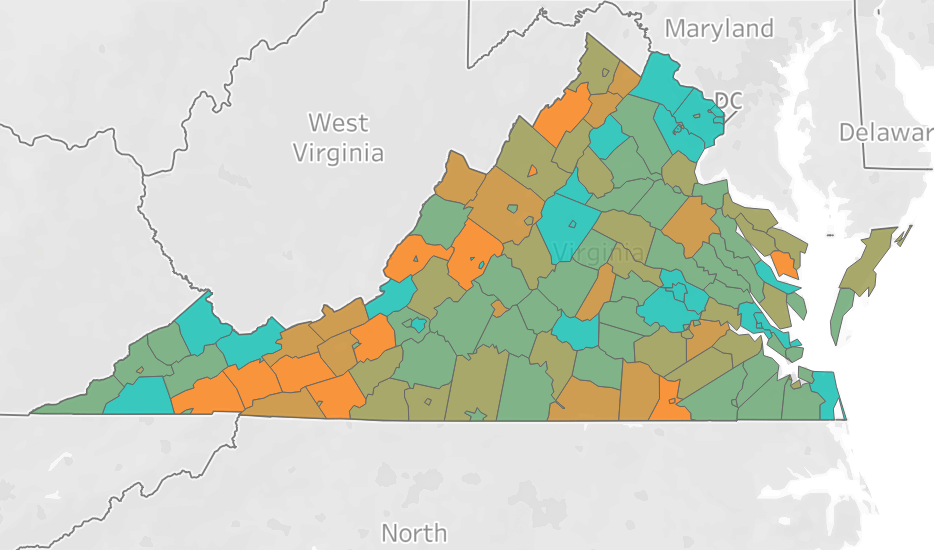
Virginia earns a B, with a social mobility reduction below the national average: 36%. As with the nation as a whole, there is far from uniform performance. Arlington County is at a 56% reduction while Smyth County is at -1%. And, as with the nation as a whole, there appears to be a rough (though far from uniform) correlation between a county’s political composition and the extent to which Unacast’s mobility data reflects social distancing.
Amid a pandemic, can the United States — can Virginia — afford any failing grades as even “Gentleman Cs” could undermine efforts to socially distance to flatten the curve?