See below for some graphics and tables about the # of bills patroned by the 76 Virginia House and Senate Democrats – as well as 17 Republicans for comparison purposes – in the 2020 General Assembly session, as well as the number of patroned bills that passed, both in absolute numbers and as a passing percentage. First, though, here are some serious caveats to keep in mind when looking at these numbers and graphics.
- As Cindy pointed out last March, after VPAP came out with its 2019 legislative “batting averages,” these numbers can be *highly* misleading if you look at them the wrong way. Or, as in the case of VPAP, they can be misleading if you fail to present the numbers with explanation, important context, etc. as VPAP indeed fails to do. [UPDATE: VPAP is now out with its 2020 “batting averages,” yet again not presented with explanation or context, but simply as a “success rate” – not good]
- For starters, as Cindy explained, “There are many, many ways that a legislator might end up with a low ‘batting average’ on the VPAP scorecard. The legislator might, in fact, put in lots of ill-conceived bills–ideas that haven’t really been thought through very well, poorly designed plays.”
- Or, “a legislator might also end up with a low score by putting in lots of controversial or partisan bills.”
- “On the flip side, a sure way to get a high score is to put in a lot of relatively sleepy little bills–clean up some badly-worded or vague section of the code, solve some minor local problem, be the patron of one of the many, many bills that are voted through unanimously – ‘in the uncontested block.'”
- “Lastly, a legislator may get a high score for having a good sense of what can or cannot pass, for working hard with stakeholders and other legislators before and during the process to tweak the language so that it will have as little opposition as possible, for being willing to amend on the fly as needed. Think of this as playing good, smart, fundamentally sound baseball.”
- “But just like a win-loss record is a poor measure of how your pitcher did, and how ‘advanced sabermetrics’ are far more revealing, this VPAP ‘batting average’ is a poor metric for how our legislators did.”
- Another important issue is that there are numerous cases where bills are listed in the Legislative Information System (LIS) as not having “passed” – thus, implying failure – when, in reality, the bills were “incorporated” into other bills, including ones that ended up passing! Which means that what LIS implies is a “failure” could actually be a success. For instance, House Majority Whip Alfonso Lopez had 13 of his bills incorporated into other peoples’ bills that passed. But that isn’t easy to find out, unless you look at the bills one at a time or talk to each legislator. Which would take many, many, many hours…no, thanks.
- I’d also note that some bills are massive, complex, technical, etc, etc. – the Virginia Clean Economy Act, for instance – and can suck up huge amounts of a legislator’s time. On the other hand, these types of bills might also be extremely important, even transformative, pieces of legislation, that are well worth spending that time. But…in spending all that time on a super-important, massive, highly complex, tremendously consequential bill, you might not be focused on churning out smaller, less “significant” bills. Should you be “dinged” for that? Not really. But a one-size-fits-all batting average might do just that. So…definitely keep that in mind when looking at the following stats.
- Also worth looking at, along with the % of patroned bills passed, is how many bills each legislator put in, and how many total bills passed. Thus, clearly having a 100% batting average is not nearly the same thing if you patroned one or two bills that passed versus, let’s say, 40-50 bills, of which perhaps half or two-thirds passed. And again, one really needs to look at how complex, “significant,” etc. each bill is, as well as how much time/effort was required of the patron to get it passed, how much help they had in doing so, etc.
- Finally, it’s important to keep in mind that different members of the General Assembly have different roles. Thus, someone in leadership might spend a big chunk of their time…well, leading! As opposed, that is, to worrying as much about their own bills. Or maybe they try to do both. But regardless, the point is, again we’re somewhat comparing apples/oranges/bananas here.
- With all those caveats, there’s an argument that, perhaps, “batting averages” and statistics like the following – or scorecards like VAPLAN‘s, for that matter – aren’t even worth presenting. Or maybe they’re worse than nothing, as they could be misleading? I’d argue that, yes, that’s all true, if you just take the “batting averages” alone, and don’t do some serious “advanced sabermetrics,” as Cindy notes. In short, I’d use the following numbers to *start* a conversation, most definitely not to *end* it. With that…here are the numbers, with a few things that jumped out at me (below each graphic) – again, looking at all House and Senate Dems, plus a sampling of Republicans for comparison purposes – from the 2020 legislative session, using information as presented by the Legislative Information System.
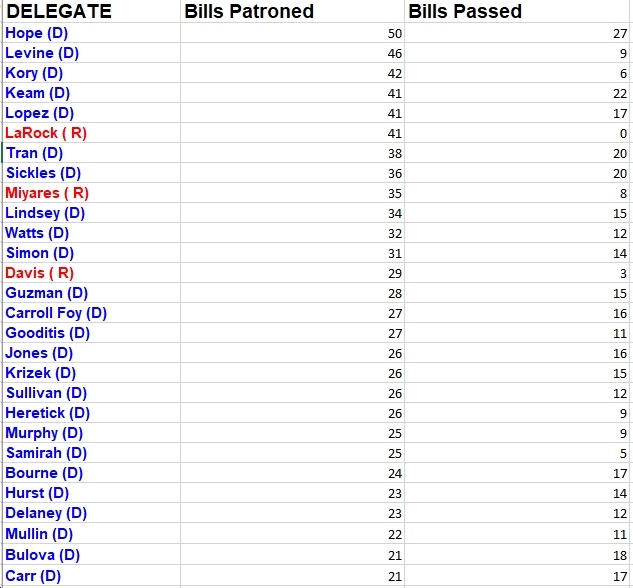
- Perhaps my favorite statistic here is that far-right Del. Dave LaRock (R), a total wingnut, patroned 41 bills but passed…zero! LOL
- Another one I enjoyed was seeing one of the biggest Republican clowns in the House of Delegates, Del. Glenn Davis, see only 3 out of his 29 patroned bills pass. There is, apparently, some justice in the world. Heh.
- On the Democratic side, Del. Patrick Hope put in a ton of bills (50!) and also passed a ton (27!). Also, Del. Mark Keam put in 41 and passed 22, while Del. Kathy Tran and Del. Mark Sickles each passed 20 bills they patroned. In contrast, Del. Mark Levine put in 46 but only passed 9; Del. Kaye Kory put in 42 and only passed 6; and Del. Ibraheem Samirah put in 25 and only passed 5.
- The numbers for Del. Luke Torian are interesting in a couple ways. For one thing, he has a high “batting average,” passing 6 out of his 9 bills, but on small numbers., On the other hand, Torian was *very* busy this session working on the Virginia budget, which is a massive job, so one could argue that he had much more important – and complex, time consuming, etc – things to do than put in a gazillion bills.
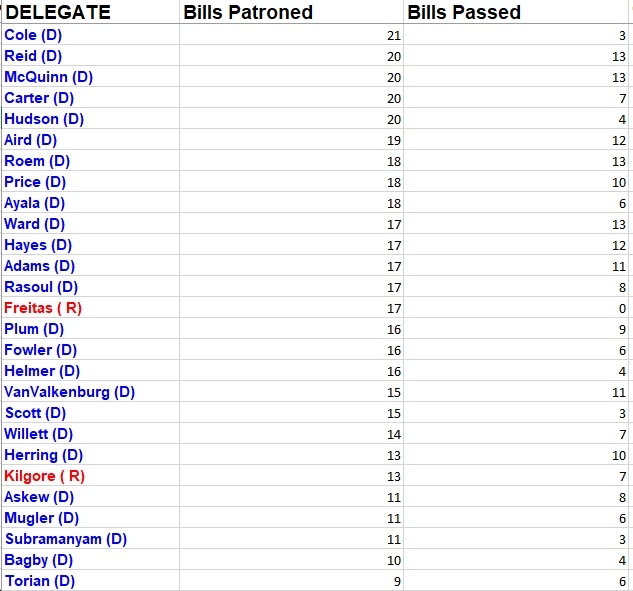
- Gotta love seeing Del. Nick Freitas (R), another extremist wingnut, passing a grand total of ZERO bills, out of the 17 he patroned. And this guy wants to be in *Congress*? That is literally the *last* thing we need.
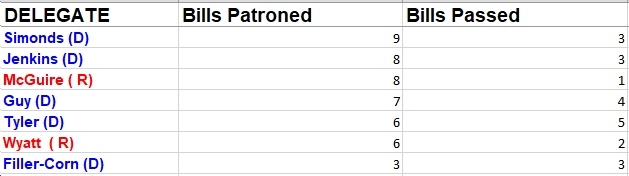
- In the case of Eileen Filler-Corn, she went 3 for 3 while getting up to speed on, arguably, the most important and powerful job in Virginia politics – Speaker of the House. Not too shabby!
- Another right-wingnut, Del. John McGuire – also running for Congress, and also the *last* thing we need – went a whopping 1 for 8. Apparently, he’s much more focused on his probably hopeless campaign for the U.S. House than actually doing his job in the Virginia House of Delegates. Lame.
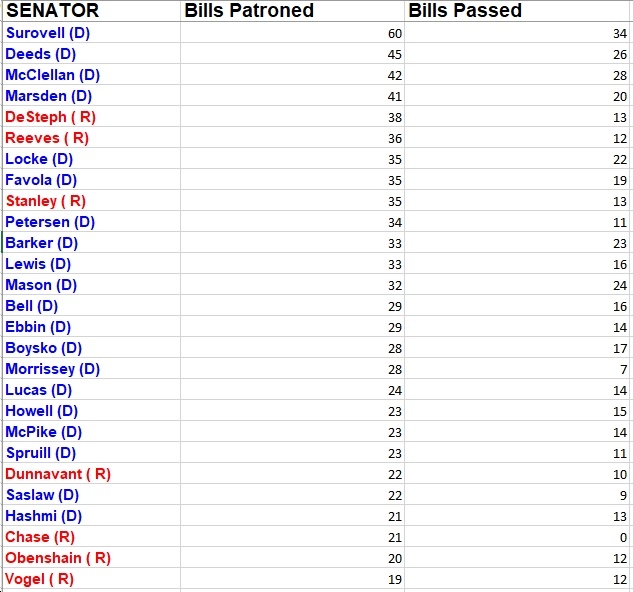
- In the State Senate, I’ve thought for years that Sen. Scott Surovell (D) never sleeps, and these statistics seem to mesh with that theory; Surovell put in a massive 60 bills – highest in the Senate – and passed an impressive 34 – again, highest in the Senate. And if you look at them, you’ll see that most of these were serious, substantive bills. So…yeah, I’m sticking with the theory that this guy never sleeps!
- Sen. Creigh Deeds (D) also was a workhorse, seeing 26 of his 45 patroned bills passing. And Jennifer McClellan wasn’t far behind, with 28 of 42 patroned bills passing.
- Quite possibly the most extreme, right-wingnuttiest member of the entire Virginia General Assembly, Sen. Amanda Chase (R), put in 21 bills and passed….zero. Of course, getting booted out of (or did she quit? both?) the Republican caucus and constantly attacking her colleagues probably didn’t help her bills’ chances of success. 😉 And she’s running for *governor*??? Uh huh…
- On the Democratic side, freshman Joe Morrissey patroned a decent number of bills (28), but only had 7 pass. In contrast, Sen. Ghazala Hashmi, also just elected in November, put in 21 bills and passed 13.
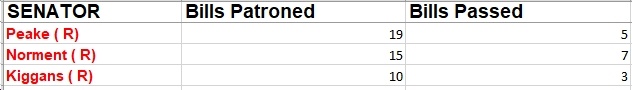
- Three different Senate Republicans, three different stories, with Senate Minority Leader Tommy Norment, a relative “moderate” in that caucus, passing 7 of his 15 bills. In contrast, right-wingnut Sen. Mark Peake (R) passed just 5 of 19 bills, while newly elected Sen. Jennifer Kiggans (R), who also appears to be pretty far right, passed just 3 out of 10 of her bills.
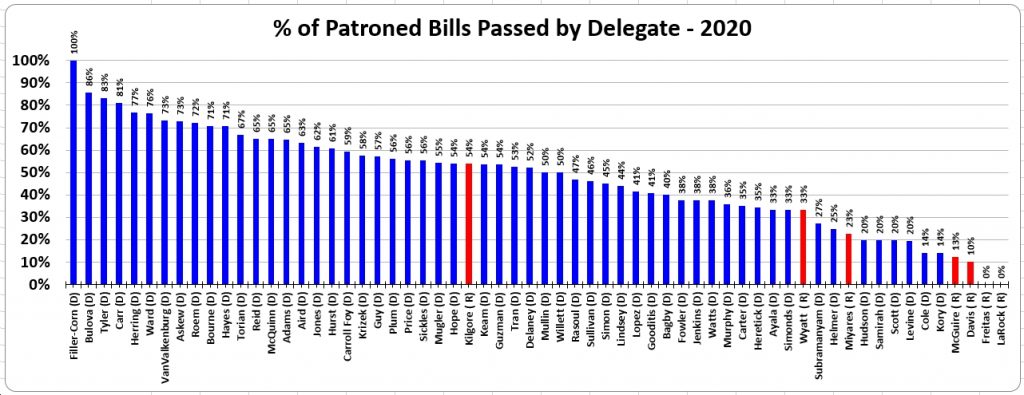
- Last but not least – but again, keeping in mind all those caveats mentioned at the beginning of this piece – here are the “batting averages,” from highest to lowest, for all the Democrats in the Virginia House of Delegates and several House Republicans, for comparison purposes.
- The top Democrats on this metric in 2020 were: Speaker Eileen Filler-Corn (100%), Del. David Bulova (86%), Del. Roslyn Tyler (83%), Del. Betsy Carr (81%), Majority Leader Charniele Herring (77%), Del. Jeion Ward (77%), Del. Schuyler VanValkenburg (73%), Del. Alex Askew (73%), Del. Danica Roem (72%), Del. Jeff Bourne (71%) and Del. Cliff Hayes (71%).
- At the bottom in terms of “batting averages” were Republican Del. Dave LaRock (0%) and Republican Del. Nick Freitas (0%), then Republican Del. Glenn Davis (10%), Republican Del. John McGuire (13%), Democratic Del. Kaye Kory (14%), Democratic Del. Josh Cole (14%), etc.
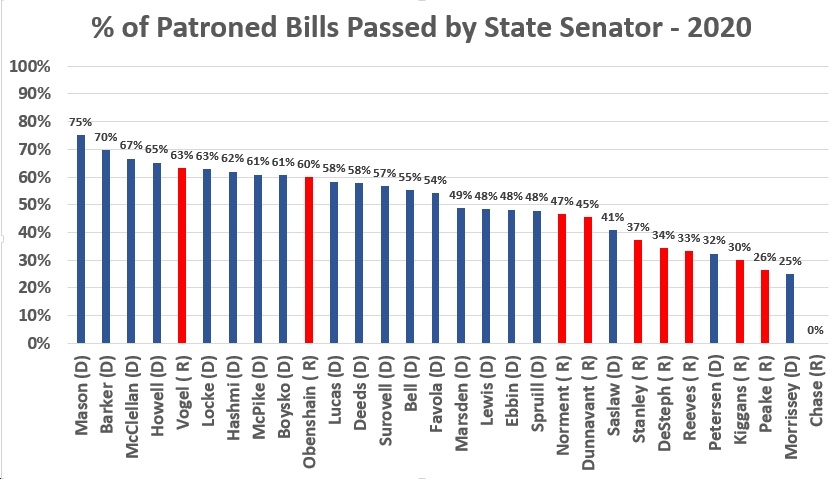
- And here are the same “batting averages” for the State Senate, with Sen. Monty Mason (D) leading the pack at 75%, followed by Sen. George Barker (D) at 70%, Sen. Jennifer McClellan (D) at 67%, Sen. Janet Howell (D) at 65%, Sen. Jill Vogel (R) at 63%, Sen. Mamie Locke (D) at 63%, Sen. Ghazala Hashmi (D) at 62%, Sen. Jeremy McPike (D) at 61%, Sen. Jennifer Boysko (D) at 61%, etc.
- And on the low end, there’s Sen. Amanda Chase (R) at 0%, with Sen. Joe Morrissey (D) at 25%, Sen. Mark Peake (R) at 26%, Sen. Jennifer Kiggans (R) at 30% and Sen. Chap Petersen (D) at 32%.