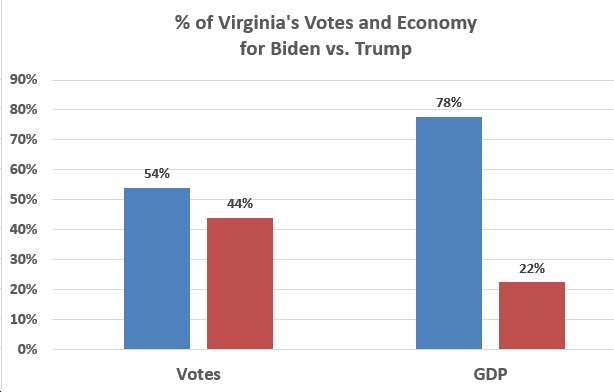
This election day, according to the Virginia Department of Elections, 54.1% of Virginia voters chose Joe Biden as their next president, while just 44.0% selected Donald Trump. So that’s a greater-than-10-point lead among Virginia *voters*. But how about if you look at Virginia jurisdictions by economic output? We’ll get to that in a second. But first, how about nationally? According to this report by Brookings, looking at the entire country, “Biden’s winning base in 477 counties encompasses fully 70% of America’s economic activity, while Trump’s losing base of 2,497 counties represents just 29% of the economy.” That’s really striking; as Brooking’s put it:
“Biden captured virtually all of the counties with the biggest economies in the country (depicted by the largest blue tiles in the nearby graphic), including flipping the few that Clinton did not win in 2016...Blue and red America reflect two very different economies: one oriented to diverse, often college-educated workers in professional and digital services occupations, and the other whiter, less-educated, and more dependent on ‘traditional’ industries.”
What about specifically here in Virginia? Did that same pattern hold? The U.S. Bureau of Economic Analysis has data tables for state economic output (GDP) by county/city. Here are the results (for 2018; “chained 2012 dollars”).

- Biden won jurisdictions encompassing 78% of Virginia’s entire economic output, while Trump only won jurisdictions encompassing 22%. That’s a really striking advantage, economically, for the “blue” parts of Virginia, and far greater than the vote breakdowns (Biden 54%-Trump 44%). That’s because “blue” parts of Virginia have much higher per capita economic output than the “red” parts of the Commonwealth.
- Fairfax/Falls Church alone accounts for 22% of Virginia’s economic output. Add in Arlington (7%), Loudoun (5%), Prince William County (4%), Alexandria (3%), and you’re talking upwards of 41% of Virginia’s entire economic output coming from “core” NoVA.
- “Blue” Henrico County adds another 5% of Virginia’s GDP. Along with Richmond (4%) and Chesterfield County (3%), those three jurisdictions account for 12% of Virginia’s economic output. Also note that Albemarle County and Charlottesville add another 2%.
- As for Hampton Roads, Norfolk accounts for 4% of Virginia’s GDP, Virginia Beach for 4%, with Newport News for 3%, Chesapeake County for 2%, Portsmouth for 1%, Suffolk for 1%, James City County/Williamsburg 1% and Hampton for 1%. Just those jurisdictions alone add up to around 17% of Virginia’s GDP.
- So…add up just the jurisdictions in the previous bullets, and you’re up to about 72%. Add in Stafford County (1%), Montgomery County/Radford (1%), Roanoke City (1%), and a bunch of few smaller ones and you’re at 78% of Virginia’s economy made up of places that went for Joe Biden last Tuesday.


![Sen. Tim Kaine on Appropriations Bills: “we shouldn’t give [Trump’s] deranged decisions the imprimatur of congressional approval by passing this legislation without significant amendment.”](https://bluevirginia.us/wp-content/uploads/2025/03/kaineblasts-238x178.jpg)
![Thursday News: “Europe draws red line on Greenland after a year of trying to pacify Trump”; “ICE Agent Kills Woman, DHS Tells Obvious, Insane Lies About It”; “Trump’s DOJ sued Virginia. Our attorney general surrendered”; “Political domino effect hits Alexandria as Sen. Ebbin [to resign] to join Spanberger administration”](https://bluevirginia.us/wp-content/uploads/2026/01/montage010826-238x178.jpg)


