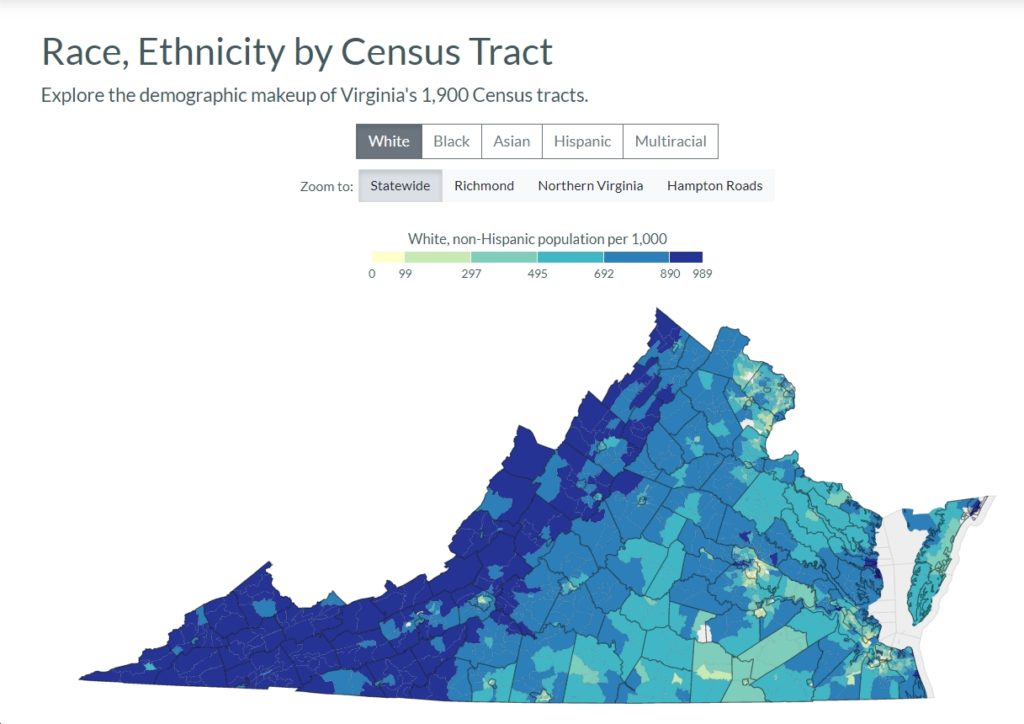
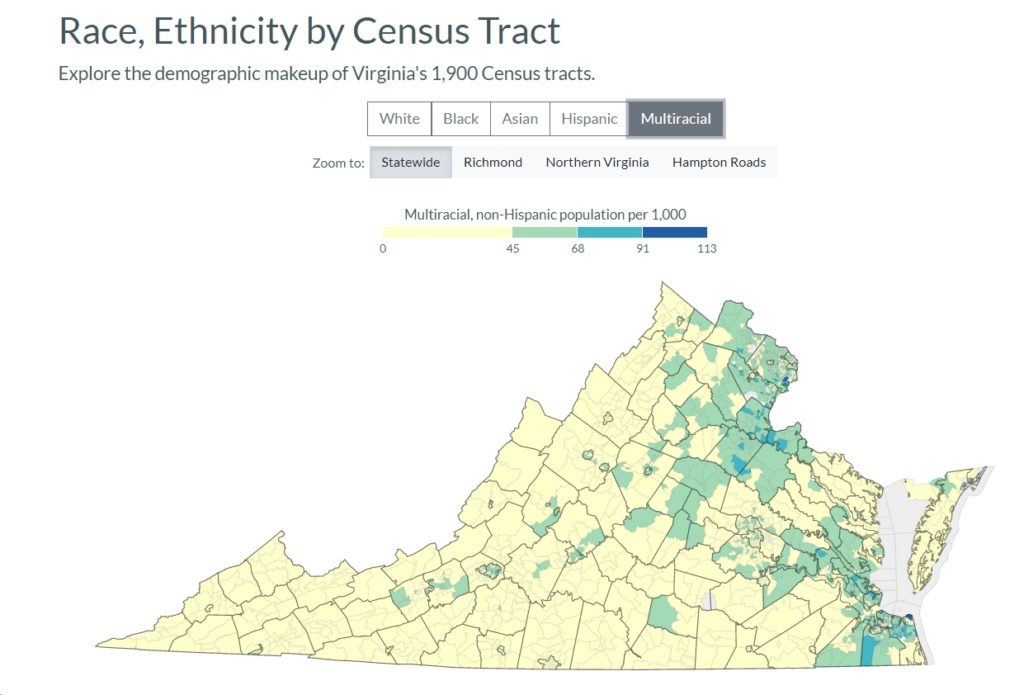
Interesting maps, courtesy of VPAP, on the racial and ethnic makeup of Virginia. A few things that jump out at me include:
- Not surprisingly, the most monolithically White/non-Hispanic areas of Virginia are heavily concentrated in southwestern Virginia (e.g., Dickenson County has 969 White/non-Hispanic people per 1,000 population) and the Shenandoah region (e.g., Highland County has 955 White/non-Hispanic people per 1,000 population).
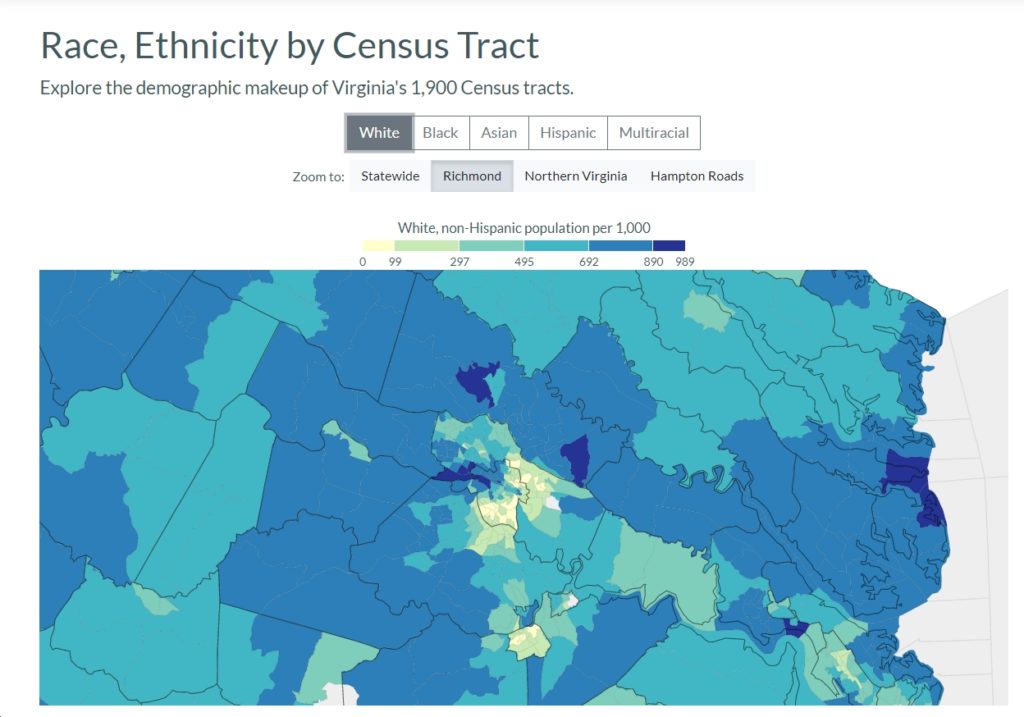
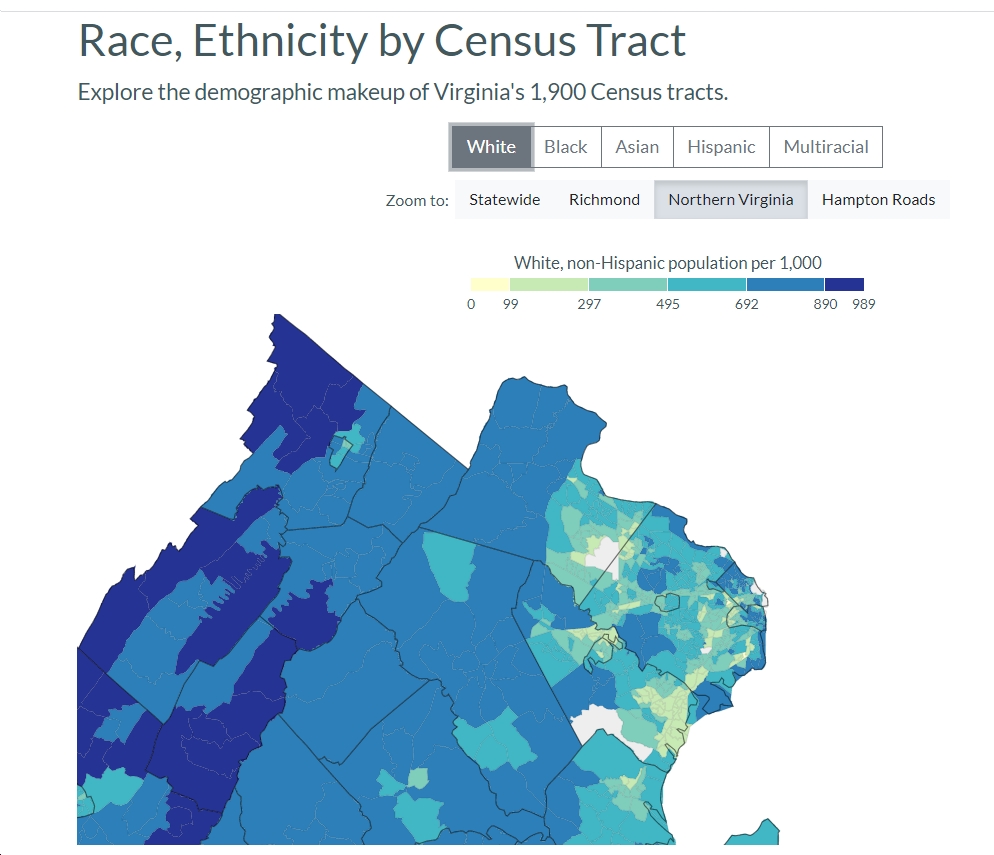
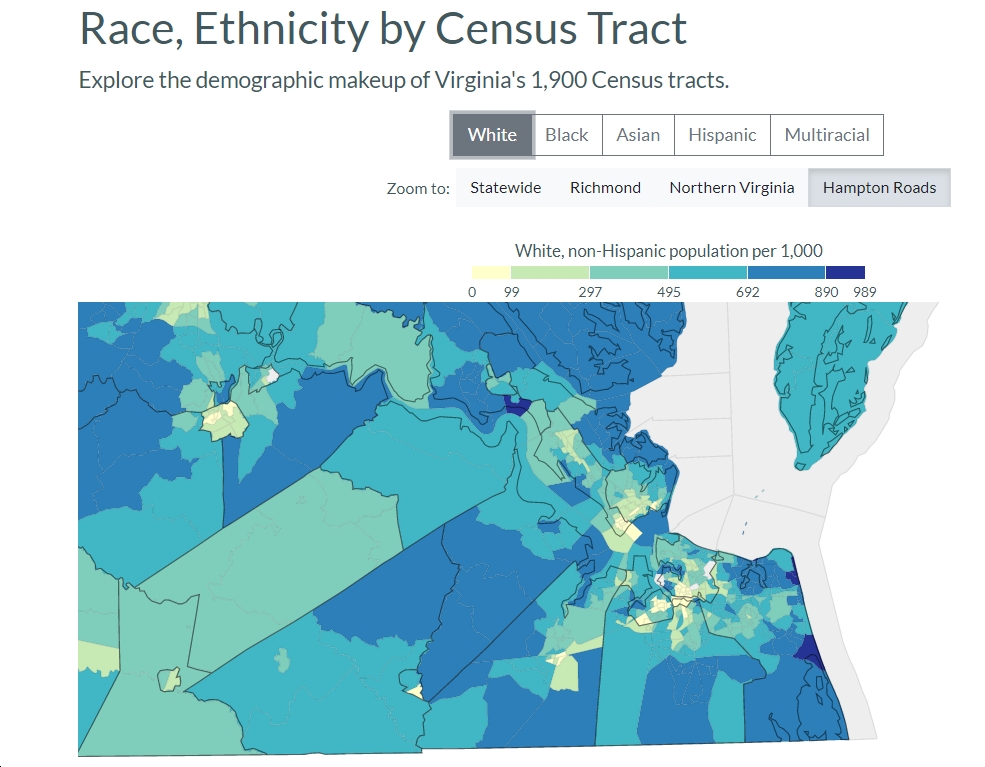
- In contrast, the northeastern, central and southeastern areas of Virginia are far more diverse, with Prince William County for instance has just 384 White/non-Hispanic people per 1,000 population and Loudoun County at just 515 White/non-Hispanic people per 1,000 population; Petersburg at just 155 White/non-Hispanic people per 1,000 population; Richmond at 420 White/non-Hispanic people per 1,000 population; Portsmouth at 357 White/non-Hispanic people per 1,000 population; Norfolk at 408 White/non-Hispanic people per 1,000 population; etc.)
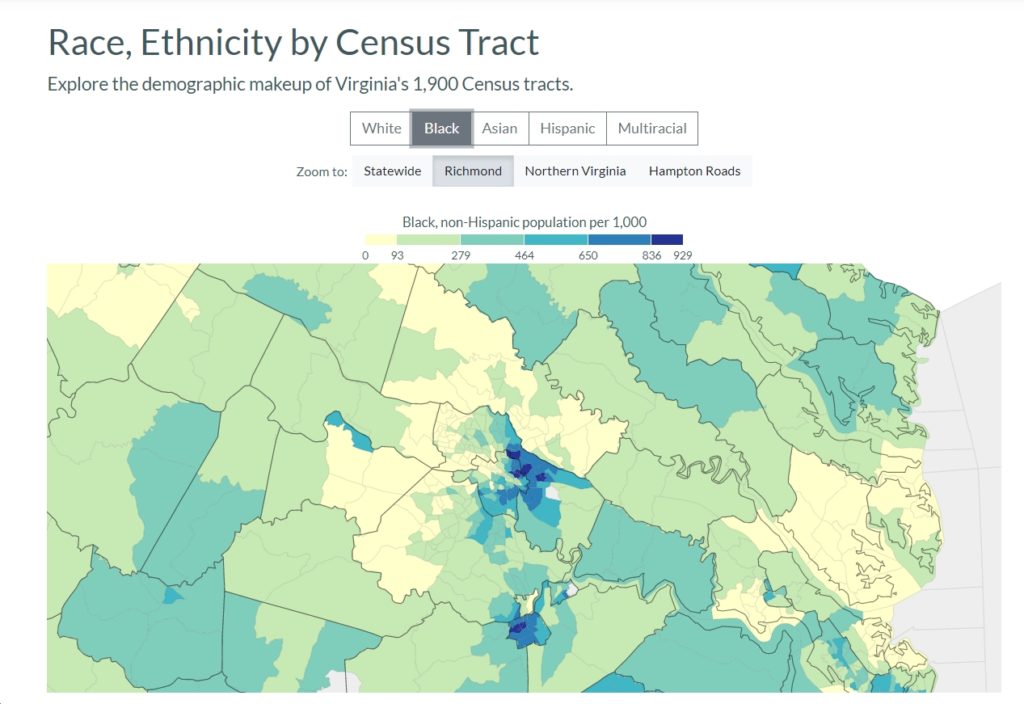
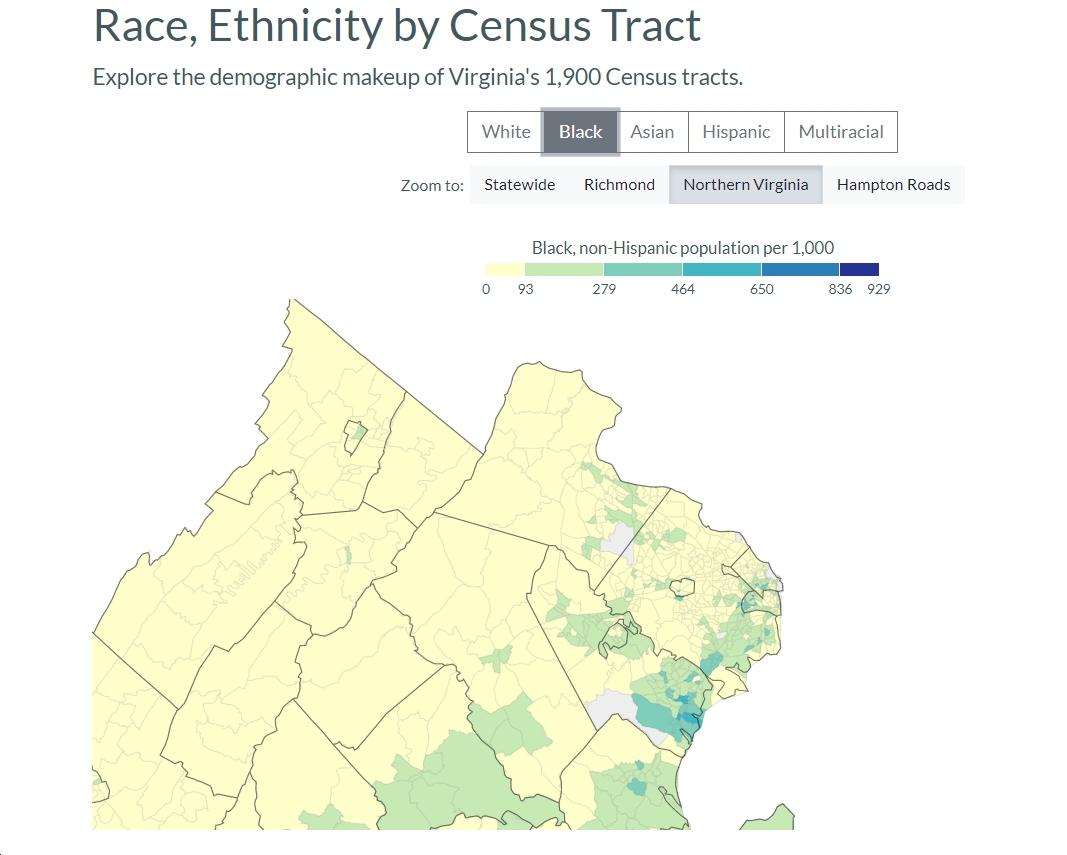
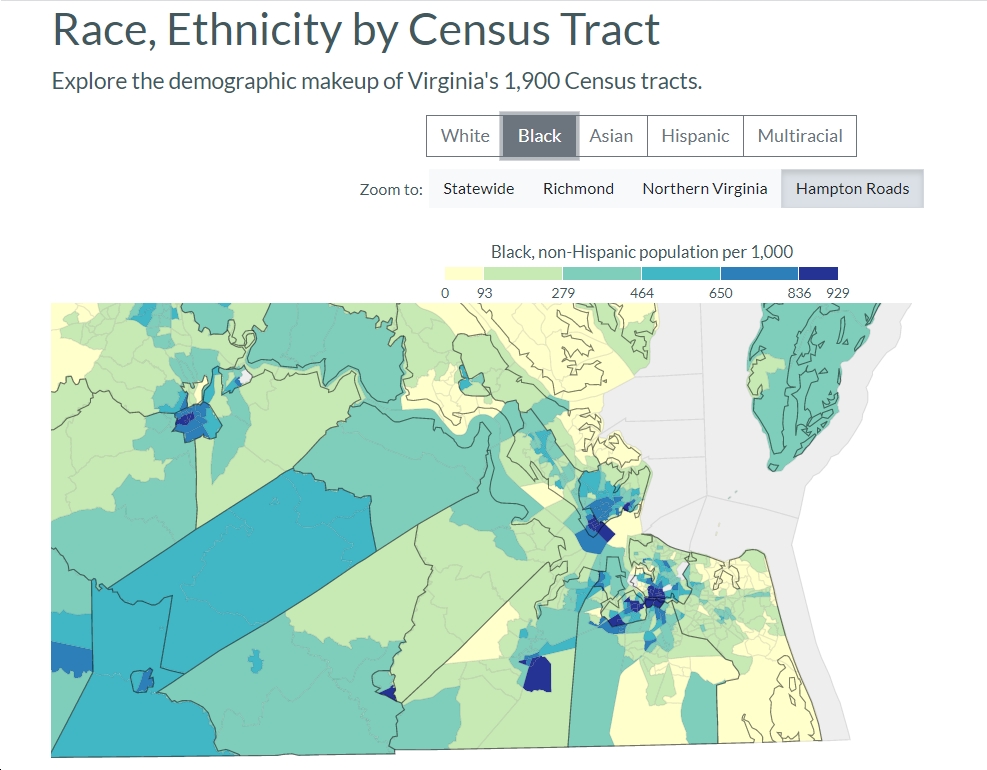
- The highest percentages of Black, non-Hispanic people in Virginia are in central Virginia (Richmond, Petersburg, etc.), Southside (Greensville County, Emporia City, Brunswick County, Sussex County, etc.) and southeastern Virginia (Hampton, Suffolk, Newport News, etc.)
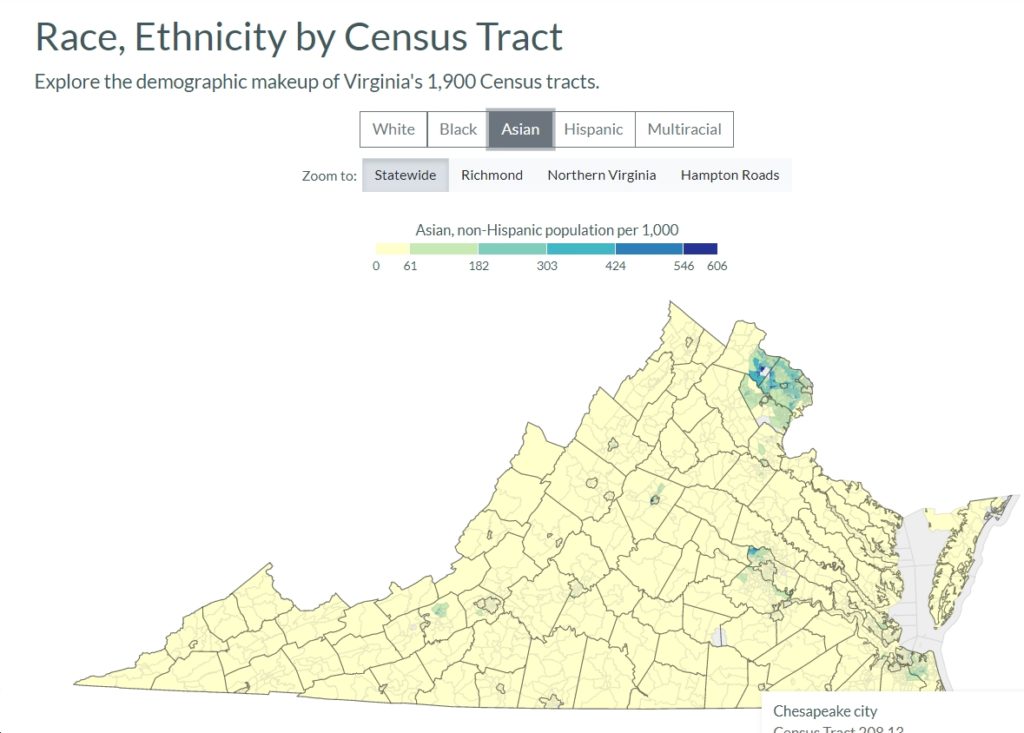
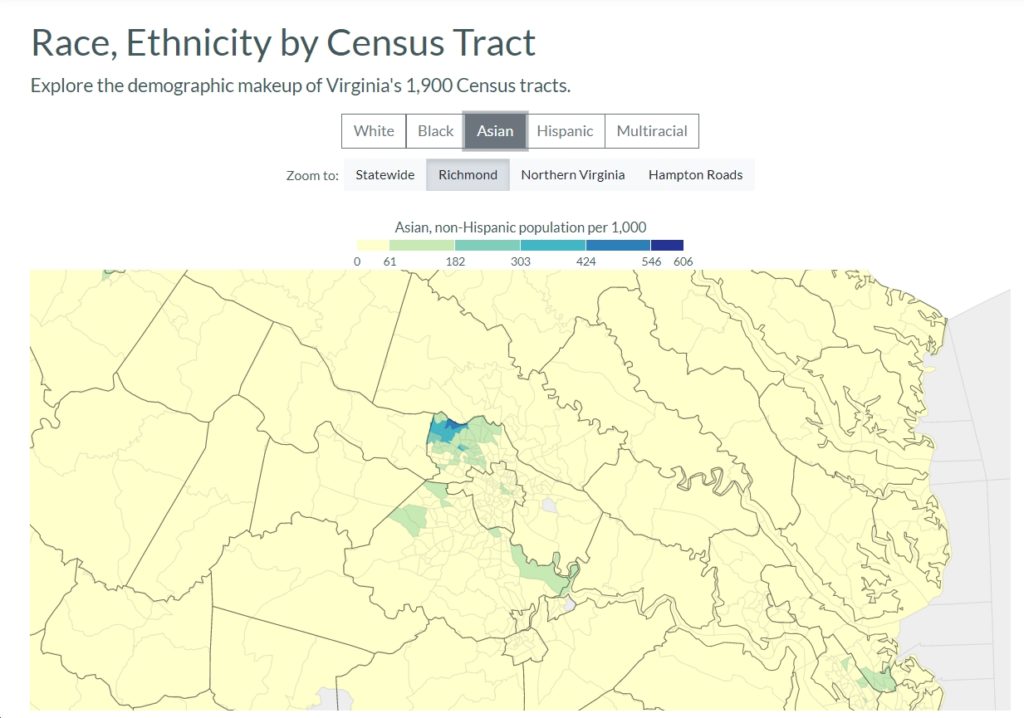
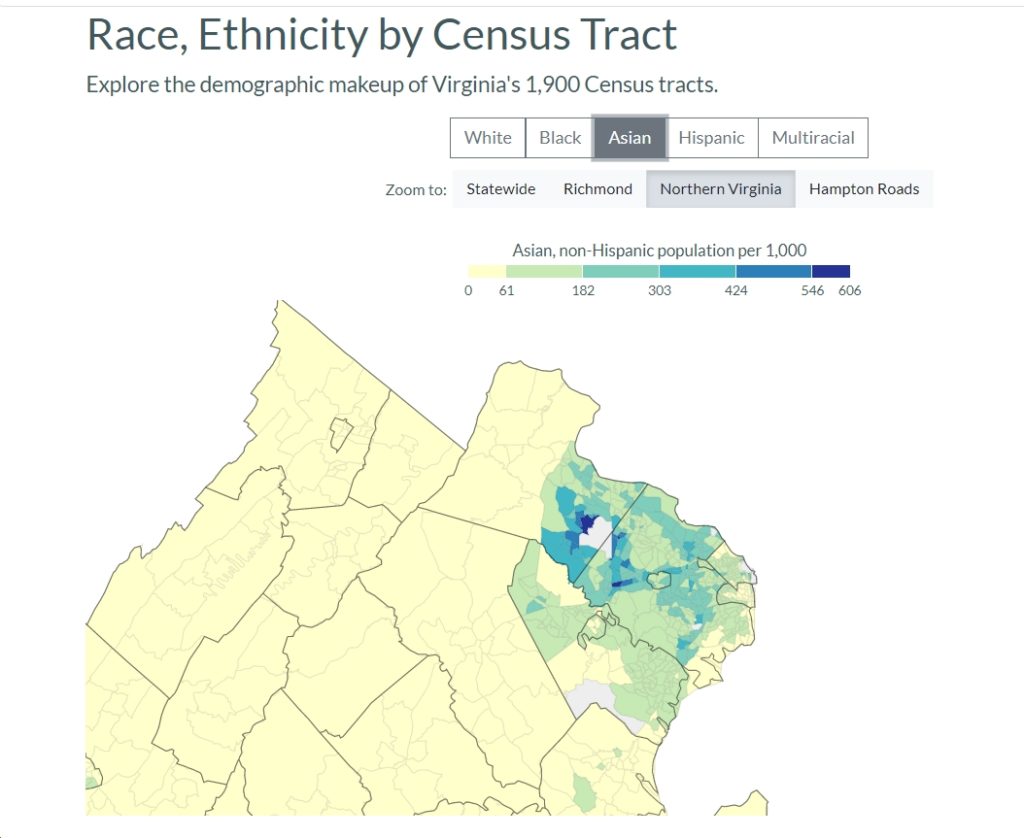
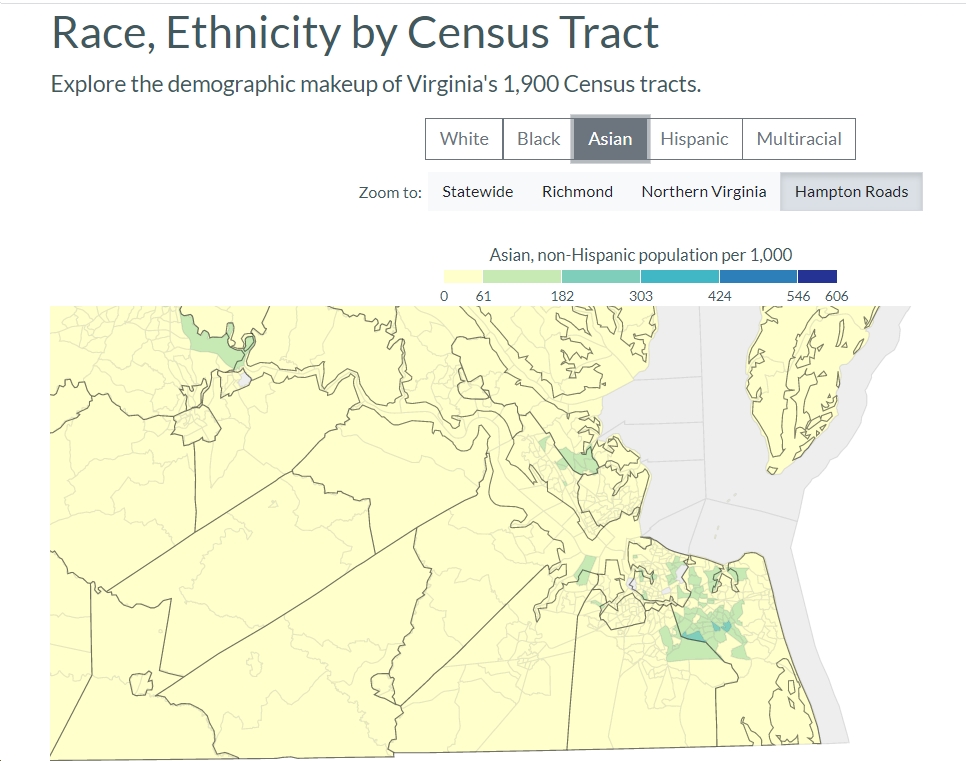
- The highest percentages of Asian people in Virginia are in Northern Virginia (Loudoun County, Fairfax County, Fairfax City, Arlington County, Manassas Park, Prince William County, Falls Church, etc.), also to a lesser extent Henrico County and Charlottesville in central Virginia; etc.
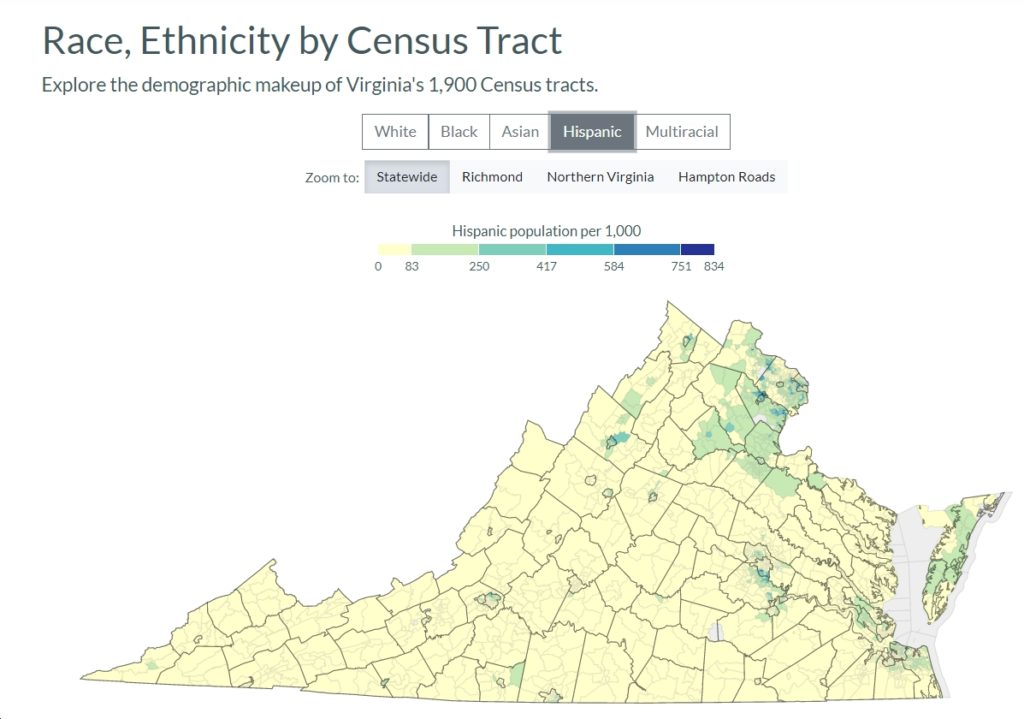
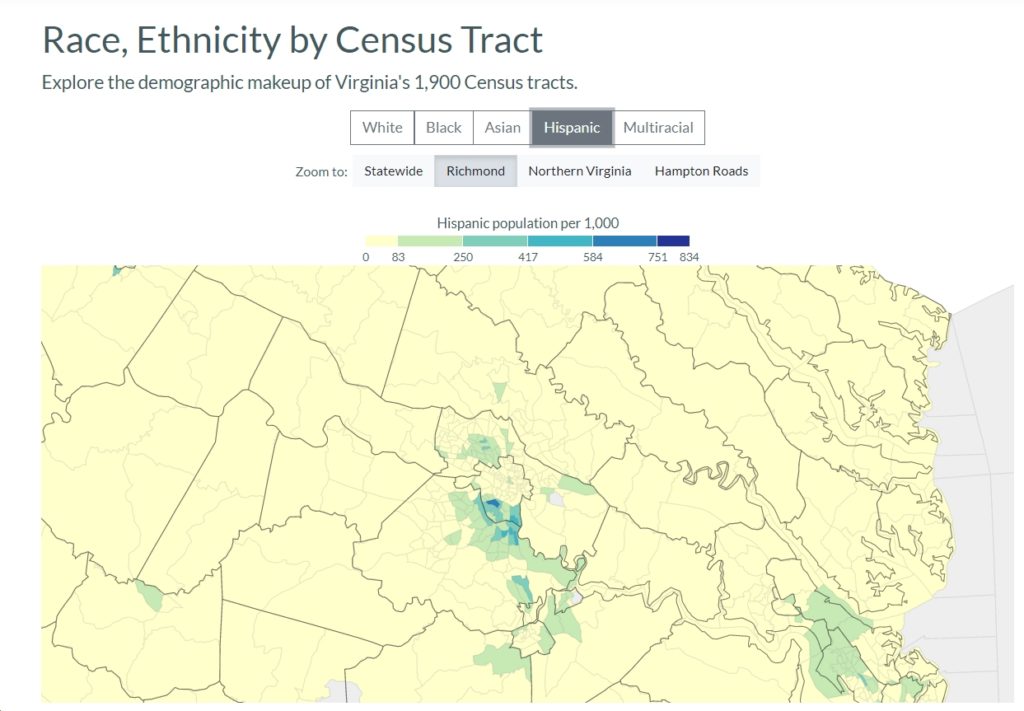
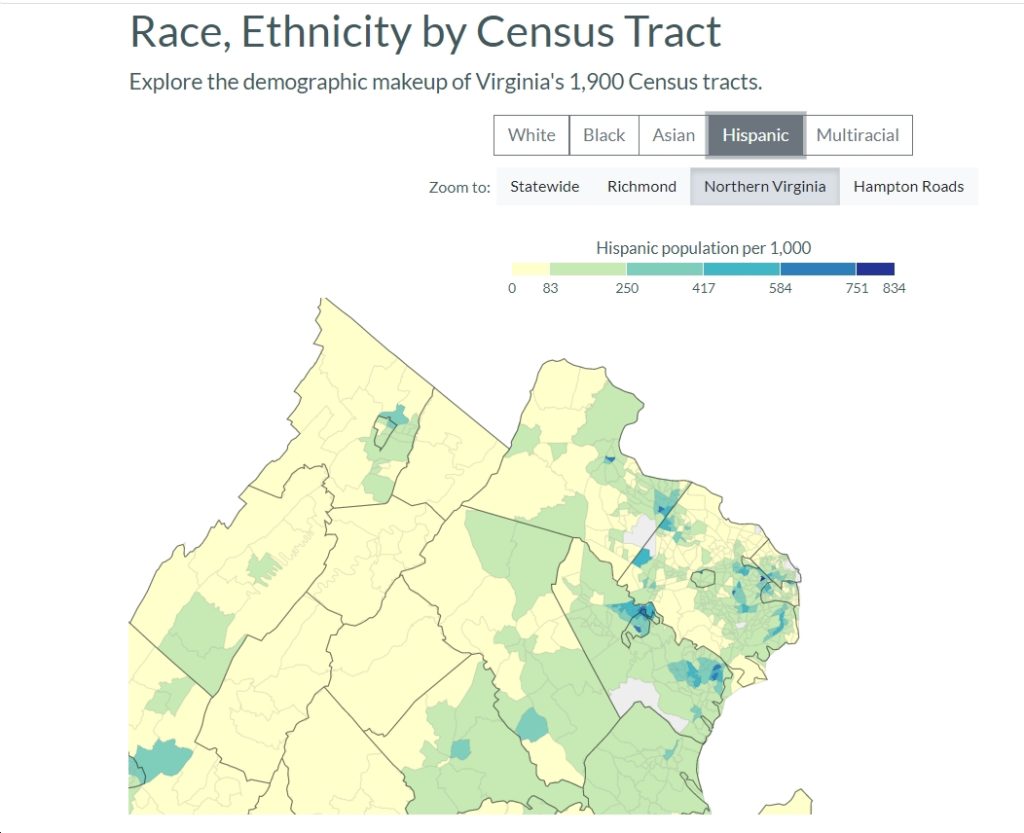
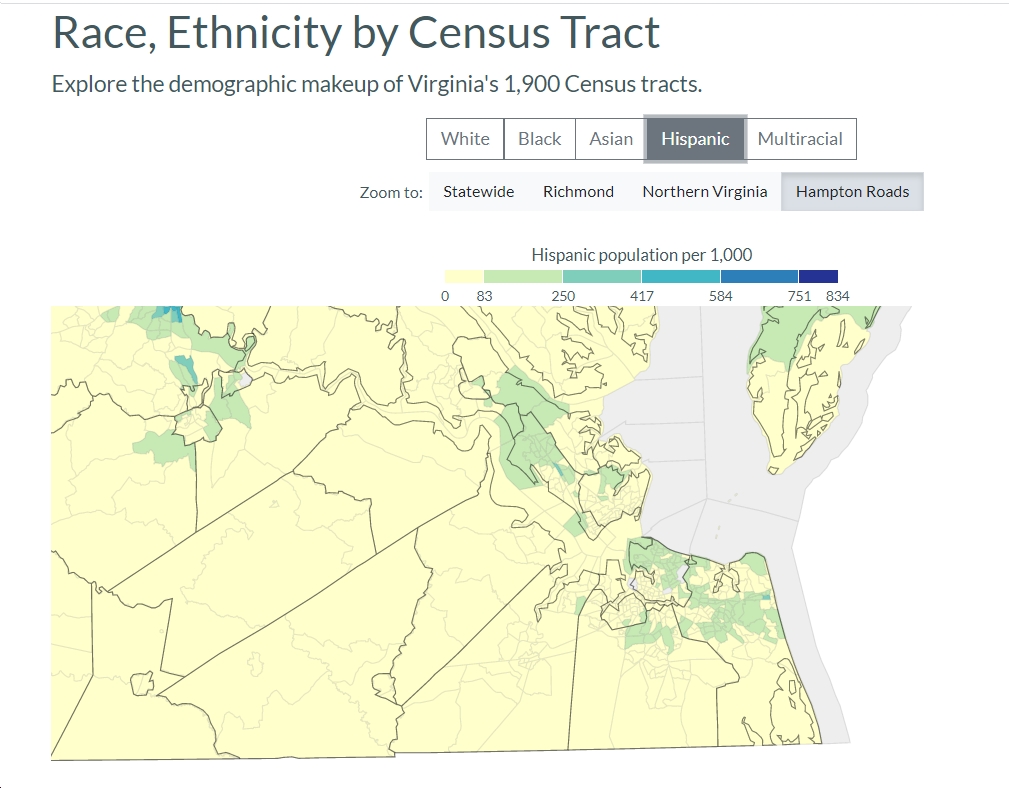
- The highest percentages of Hispanic people in Virginia are in Northern Virginia (Manassas Park, Manassas, Prince William County, Alexandria, Fairfax City, Fairfax County), also Harrisonburg and Winchester in western Virginia; etc.
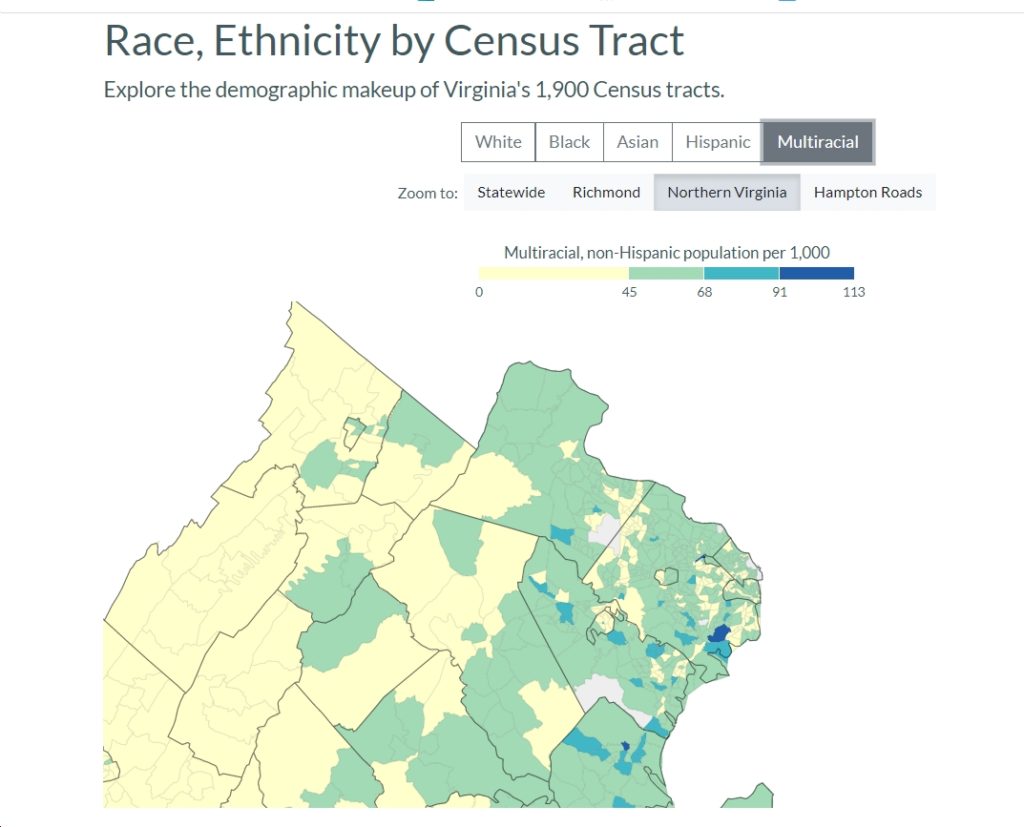
- Zooming in on Northern Virginia, there are large differences in diversity depending on exactly where in the region we’re talking about. Basically, the further west you go, the higher percentage of the White population there is, while in more densely population, urban/inner-suburban parts of the region, it’s generally more diverse, although even within those more diverse counties/cities, there are big differences in diversity depending on exactly where one lives. For instance, the northernmost parts of Arlington County are heavily White, while south Arlington tends to be much more diverse. Or in Alexandria, the western parts tend to be very diverse, while the eastern parts tend to have high percentage of White, non-Hispanic people.
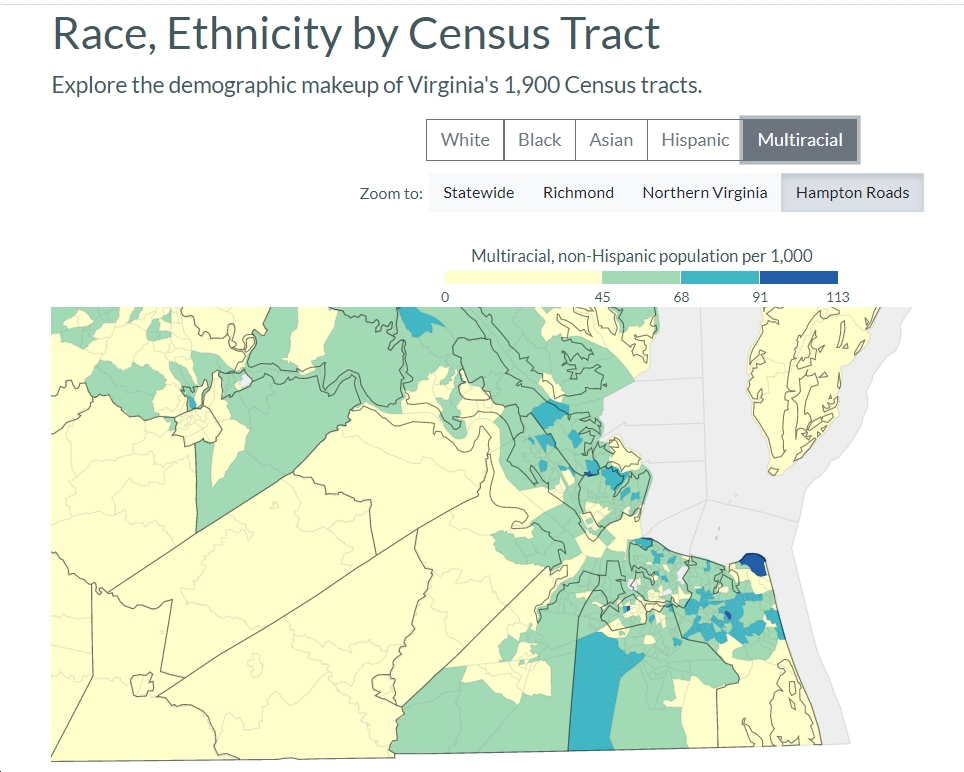
- In the Richmond and Hampton Roads areas, exactly where you live also makes a huge difference in terms of diversity. with Census Tract 505 in Richmond City at 795 White/non-Hispanic per 1,000 vs. Census Tract 608 at just 61 White/non-Hispanic per 1,000. Or in Virginia Beach, Census Tract 438 has 907 White/non-Hispanic per 1,000 vs. Census Tract 404.06 at just 184 White/non-Hispanic per 1,000. In short, even areas that look diverse overall aren’t particularly diverse when you zoom in on the neighborhood level…

![[UPDATED with Photos, Video] Virginia “No Kings” Events for Saturday (3/28)](https://bluevirginia.us/wp-content/uploads/2026/03/virginianokings0328-350x250.jpg)