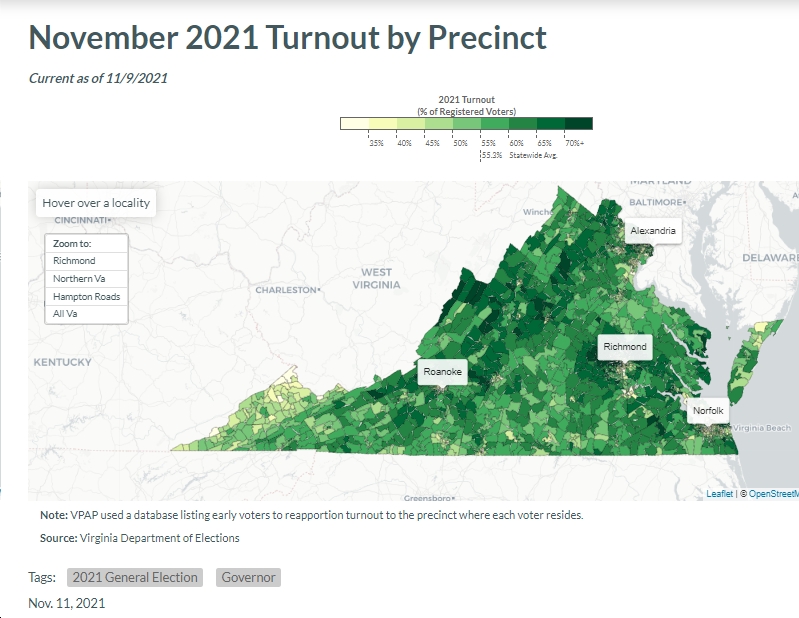
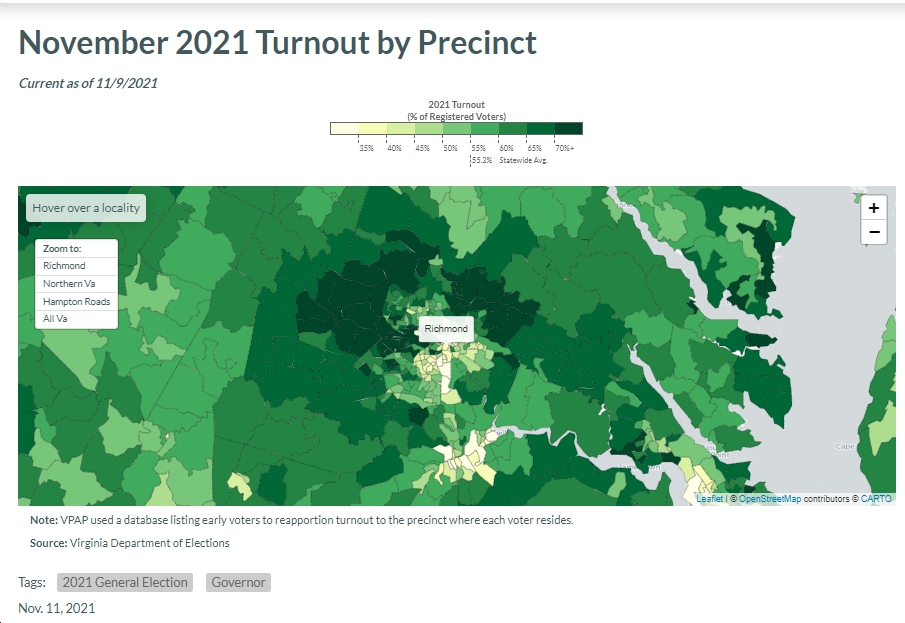
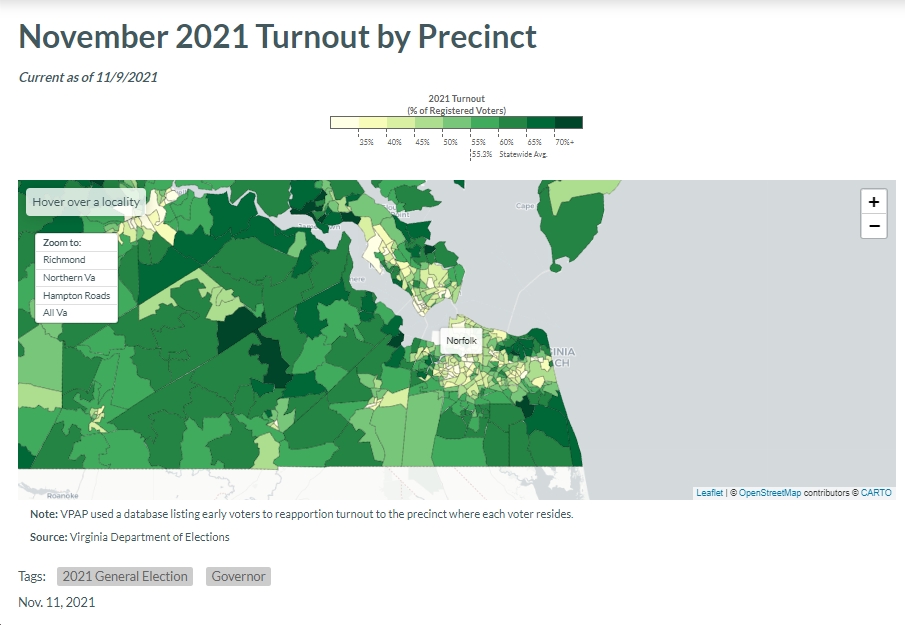
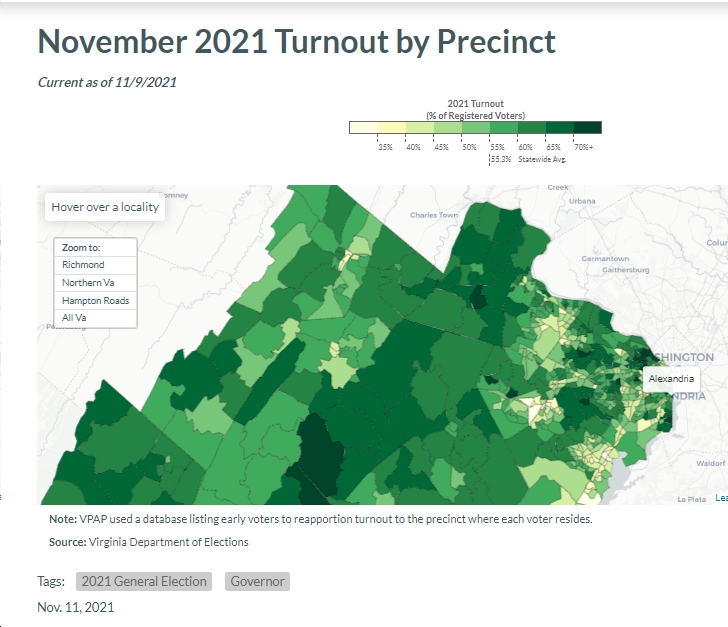
See below for some maps, by VPAP, of November 2021 turnout by precinct. A few things that jump out at me include:
- In the Richmond area, turnout was VERY high (in the 70%’s – presidential level!) in deep-“red” areas like in Goochland County’s “Centerville” and “Shallow Well” precincts; in Hanover County’s “Studley” and “Rural Point” precincts; Powhatan County’s “Manakin” and “Subletts” precincts; etc. These precincts went heavily or even overwhelmingly (e.g., 80%-20% in the case of “Subletts”; 76%-24% in the case of “Manakin”) for Glenn Youngkin.
- In contrast, “blue” precincts in the Richmond area did NOT show particularly high turnout, relatively speaking. For instance, in Richmond City, many heavily Democratic precincts’ turnout were only in the 30%’s or 40%’s; in deep-“blue” “Laburnum” precinct in Henrico County, turnout was only 40.7%; etc.
- In the Hampton Roads area, we see a similar pattern – high turnout in “red” precincts, “meh” (or worse) turnout in “blue” precincts. For instance, in Virginia Beach, the heavily Republican “Courthouse” precinct saw a massive 70.1% turnout, as did “Kingston” (70.4% turnout; went heavily for Youngkin) and “Sandbridge” (67.3%; went heavily for Youngkin); etc. In contrast, deep-“blue” areas in Norfolk saw turnout in the 20%s, 30%s or 40%s (e.g., the overwhelmingly McAuliffe “Chesterfield” precinct only saw 32.3% turnout; the heavily McAuliffe “Titustown” precinct only saw 25.8% turnout). So…the “reddest” precincts in Hampton Roads turned out at rates more than twice the “bluest” precincts. Not good at all…both for the statewide ticket and also for several competitive House of Delegates races, which Democrats *absolutely could have won* with better turnout!
- In Northern Virginia, again we see a similar pattern: the “bluest” precincts turned out at MUCH lower rates than the “reddest” ones, or even the relatively less-“blue” precincts. For instance, in heavily Democratic Alexandria, the “John Adams School” precinct went heavily for McAuliffe, but only turned out at a 33.6% rate, while the “City Hall” precinct went narrowly for McAuliffe but turned out at a 66.6% rate. In Arlington, clearly turnout was MUCH higher in the wealthy, mostly white, single-family-home far-north precincts (e.g., “Madison” went only by a relatively small margin for McAuliffe and turned out at 71.7%; same thing with “Thrifton”, which turned out at 71.0%) than in more diverse, less-wealthy southern part of the county (e.g., “Glebe” precinct went heavily for McAuliffe but turned at only 47.5%). And in Prince William County, some of the lowest-turnout precincts were in the “bluest” parts of the county (e.g., “Grayson” at just 32.5%, “Porter” at just 34.3%) while “redder” precincts turned out at much higher rates (e.g., “Heritage Hunt” at 72.9%, “Alvey” at 76.1%).
Sensing a pattern here? Bottom line: for a variety of reasons (including tapping into and stoking anger, grievance, etc.), the Youngkin campaign was able to energize its “base” voters to turn out at incredibly high rates for a gubernatorial election, while the McAuliffe campaign wasn’t able to keep up…or even close, really (again, for a variety of reasons, including President Biden’s relatively low approval ratings and the absence of a real equivalent to Youngkin’s potent-albeit-dishonest-and-disgusting “Southern Strategy” variant), resulting in McAuliffe’s relatively narrow loss (by 2 points) in a state that Joe Biden had just won the year before by 10 points, and which Ralph Northam won in 2017 by 9 points.
