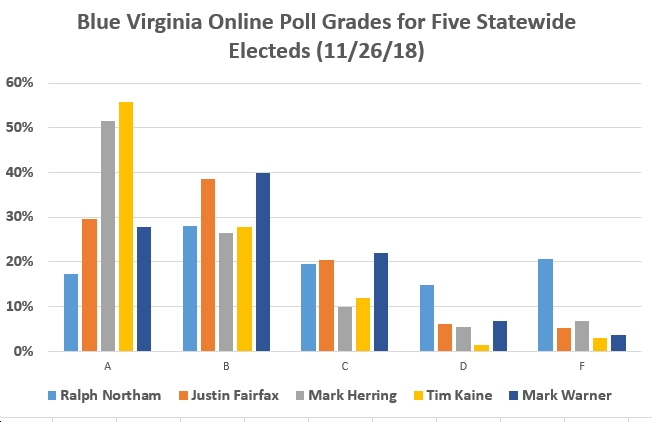
The online, unscientific polls of Blue Virginia readers’ views on our five statewide elected officials are now complete. Here are a few graphs displaying the results.
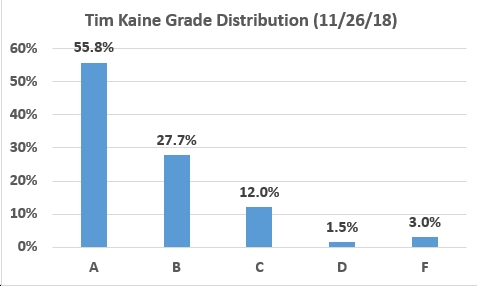
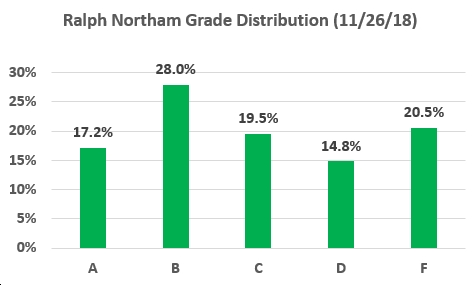
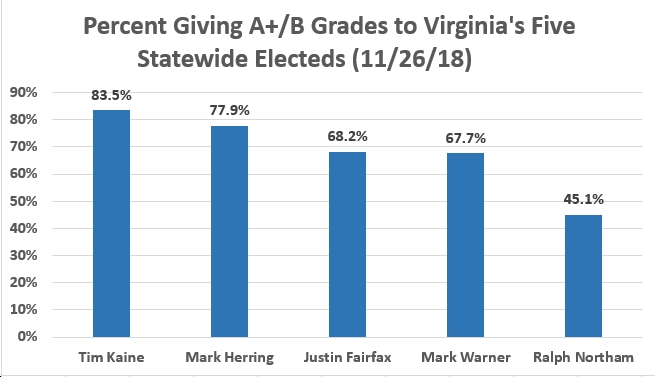
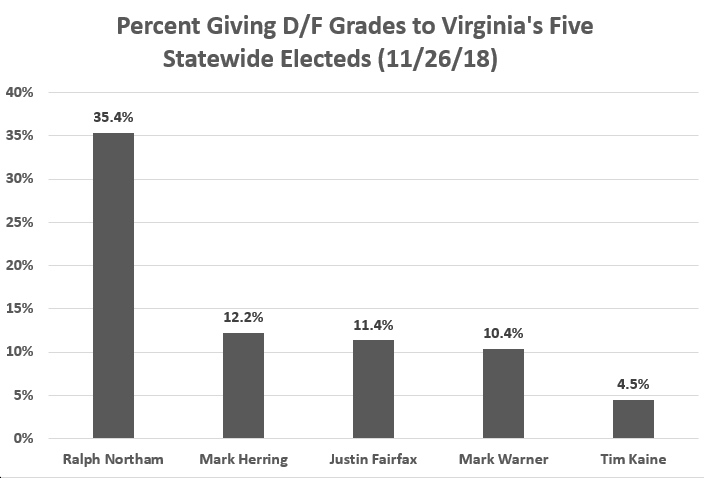
The first two graphs show the most popular (Sen. Tim Kaine) and least popular (Gov. Ralph Northam) of the five statewide elected officials. Note that 83.5% of voters gave Kaine A+ or B scores, while only 45.1% gave Northam A+ or B scores. Close behind Kaine was Virginia AG Mark Herring, with 77.9% A+/B scores. Not surprisingly for a pro-Democratic blog, four of the Virginia statewide elected officials received very low combined D/F grades (12.2% for Mark Herring, 11.4% for LG Justin Fairfax, 10.4% for Sen. Mark Warner, 4.5% for Sen. Tim Kaine). The one outlier: Ralph Northam, with 35.4% D/F grades, presumably as a result of his support for the Atlantic Coast Pipeline and Mountain Valley Pipeline.
Of course, these polls aren’t scientific in any way, but I suspect they do reflect the attitudes of many Blue Virginia readers. So, take these with a grain or pillar of salt or whatever…