A new report by the Robert Wood Johnson Foundation and the University of Wisconsin Population Health Institute has some interesting – and in many ways troubling – findings regarding health rankings in Virginia. See below the map for some highlights.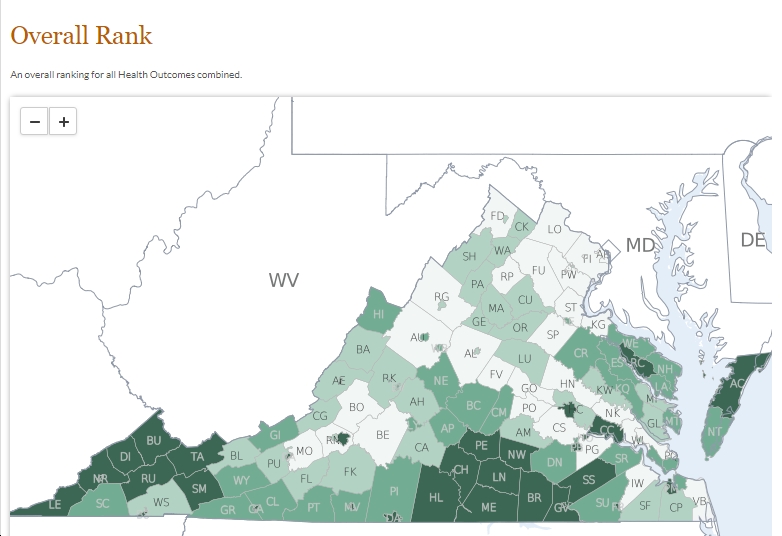
- “In Virginia, there are differences by race/ethnicity in length and quality of life that are masked when we only look at differences by place”
- Years lost to premature death per 100,000 people vary widely by Virginia jurisdiction and by racial/ethnic group: 3,400 in the healthiest Virginia county (Loudoun County…followed by Arlington County, Fairfax County, Falls Church City, Albemarle County, York County and Alexandria City) vs. 18,600 (!) in the least healthy Virginia jurisdiction (Petersburg City, ranking just behind Covington City, Galax City, Franklin City, Martinsville City, Emporia City, Hopewell City and Danville City); 2,600 among Asians/Pacific Islanders vs. 8,900 among African Americans; etc.
- The percentage of people in poor or fair health also varies widely, from 12% in the healthiest Virginia county (Loudoun County) to 26% in the least healthy jurisdiction (Petersburg City); from 6% among Asian Americans/Pacific Islanders to 24% among Hispanics, 22% among American Indian/Alaska Native and 21% among African Americans; etc.
- Similar disparities exist in terms of low birthweight, poor mental health days and poor physical health days.
- “Health factors in the County Health Rankings represent the focus areas that drive how long and how well we live, including health behaviors (tobacco use, diet & exercise, alcohol & drug use, sexual activity), clinical care (access to care, quality of care), social and economic factors (education, employment, income, family & social support, community safety), and the physical environment (air & water quality, housing & transit).”
- “Housing is central to people’s opportunities for living long and well. Nationwide, housing costs far exceed affordability given local incomes in many communities. As a result, people have no choice but to spend too much on housing, leaving little left for other necessities.”
- “In Virginia, 14% of children are living in
poverty,” with “children in poverty among Virginia counties
rang[ing] from 3% to 40%” and “child poverty rates among racial/ethnic groups in Virginia rang[ing] from 7% to 30%.” - “In Virginia, 13% of households spend more than
half of their income on housing costs. Across Virginia counties, severe housing cost burden ranges from 4% to 27% of households. Severe housing cost burden ranges from 10%
to 20% among households headed by different racial/ethnic groups in Virginia. “ - “In Virginia, 66% of households own their home. Homeownership rates among Virginia counties range from 36% to 90% of households. Homeownership rates among racial/ethnic groups in Virginia range from 46% to 73%. “
- In terms of “health behaviors,” the percentage of adult Virginians who smoke ranges from 10% to 24%, depending on the jurisdiction. Also depending on jurisdiction, adult obesity ranges from 20% to 43%. “Access to exercise opportunities” ranges from just 9% to 100%. Sexually transmitted infection rates range from 55.1 to 1,638 (!) per 100,000 population, depending where one lives in Virginia.
- In terms of “clinical care,” the percentage of Virginians under 65 without health insurance ranges from 4% to 18%, again depending on where one lives. The ratio of population to primary care physicians ranges widely, from 310:1 to 15,420:1, with similar disparities for dentists and mental health providers. And the percentage of those getting flu vaccinations (22% to 59%) and mammography screening (30% to 56%) also ranges widely, depending on where one lives in Virginia.
- “Social and economic factors” also vary widely in Virginia. For instance, the percentage of adults ages 25-44 with some post-secondary education ranges from a low of 26% to a high of 90%. The percentage of children in poverty ranges from a low of 3% to a high of 40%. The percentage of children in single-parent households ranges from 14% to 70%. And the violent crime rate per 100,000 population ranges from 40 to 714.
Add all these up, and you get the aggregate results – and the huge disparities – reported. Looking at the map, you can see it clearly: the worst health outcomes are in some of the poorest parts of Virginia – far Southwestern Virginia and Southside – while the best health outcomes are in the wealthier areas, such as Northern Virginia. There are also disparities based on race and ethnicity, as noted above. The question is, what are we going to do to rectify this situation? For starters, I’d argue for moving to a a system of universal healthcare coverage. I’d also argue for shifting policies in ways that encourage healthier diets and development patterns, among other things. We also need to work to make the air and water cleaner, and to reduce gun violence, among other things. Note that Republicans have basically nothing to contribute – in fact, quite the contrary – in any of those areas, which means that if you care about any of this stuff, you should most certainly be voting Democratic up and down the ballot, every election…

 Says Rep. John McGuire (R-VA05) Is “kick[ing] those people [he represents] to the curb…[to] give another tax credit to Elon Musk and Peter Thiel”")
 Doubles Down on Vote to Jack Up Health Care Costs; Claims 3 Years “a very long time” for Families to Have Access to ACA Tax Credits")