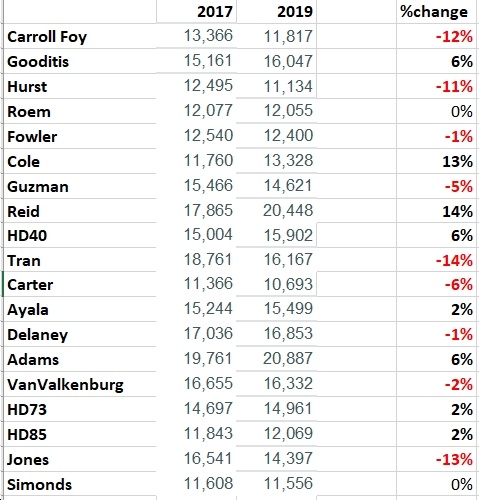
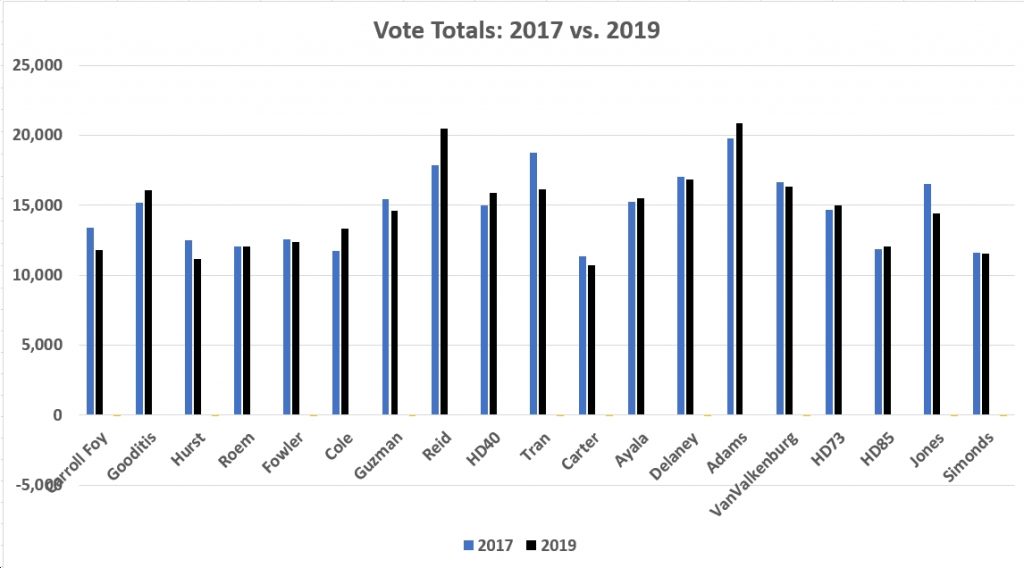
How did vote totals change in key Virginia House of Delegates districts between 2017 and 2019? Obviously, this is not an “apples-to-apples” comparison, as 2017 was a gubernatorial election year and 2019 was an “off/odd” election year, which traditionally has had MUCH lower turnout than the gubernatorial year. So this time around, essentially the House of Delegates candidates first elected in the 2017 gubernatorial “blue wave” election were on their own, in the sense that they didn’t have any statewide candidates on the ballot above them. How did they end up doing, despite this? See below for their vote totals in 2017 and 2019, plus the % change from 2017 to 2019.
As you can see, eight candidates (or in the cases of HD40, HD73 and HD85, where there were different candidates in 2017 and 2019) actually got MORE votes in 2019 than they got in 2017. Del. David Reid (D-HD32), actually went up by 14% from 2017, although notably he had no opponent this time around. And Josh Cole (D-HD28) went up 13% compared to 2017, when he lost by by just 82 votes. Also, Del. Wendy Gooditis (D-HD10) went up 6%; Dan Helmer in HD40 increased 6% over Donte Tanner in 2017; Del. Dawn Adams (D-HD68) went up 6%; Rodney Willett (D-HD74) improved 2% on Debra Rodman’s 2017 vote totals; and Alex Askew (D-HD85) improved 2% over Cheryl Turpin in 2017.
The biggest declines? Del. Kathy Tran (D-HD42) fell 14%; Del. Jay Jones (D-HD89) fell 13%; Del. Jennifer Carroll Foy (D-HD2) fell 12%; Del. Chris Hurst (D-HD12) fell 11%; Del. Lee Carter (D-HD50) fell 6%; and Del. Elizabeth Guzman (D-HD31) fell 5%.
Overall, it’s impressive that Democrats largely held their own in 2019 compared to 2017, given no “top-of-the-ticket” races to drives turnout. Which is why, in large part, Democrats picked up another six seats this time around, after a massive 15-seat gain (from a much lower base, of course) in 2017.
P.S. For 2019 vote percentages, click here, and for 2017 vote percentages, click here.


![Video: Former Eastern District of VA Federal Prosecutor Gene Rossi Asks, “Is Donald Trump going to be the lead counsel in that prosecution [of Jim Comey] and do the opening, closing and rebuttal? I pray that he does!”](https://bluevirginia.us/wp-content/uploads/2025/09/rossiedva-238x178.jpg)


![[UPDATED 1/29/26] Audio: Sen. Tim Kaine Talks to Blue Virginia About His “Five-Point Plan” to Fight Trump’s Orban-Like Assault on US Democracy; Civil Disobedience a la MLK Jr.; Trump’s Bogus “Energy Emergency”; the Crucial Importance of the 2025 VA Elections; etc.](https://bluevirginia.us/wp-content/uploads/2025/02/kaineinterview2-100x75.jpg)

