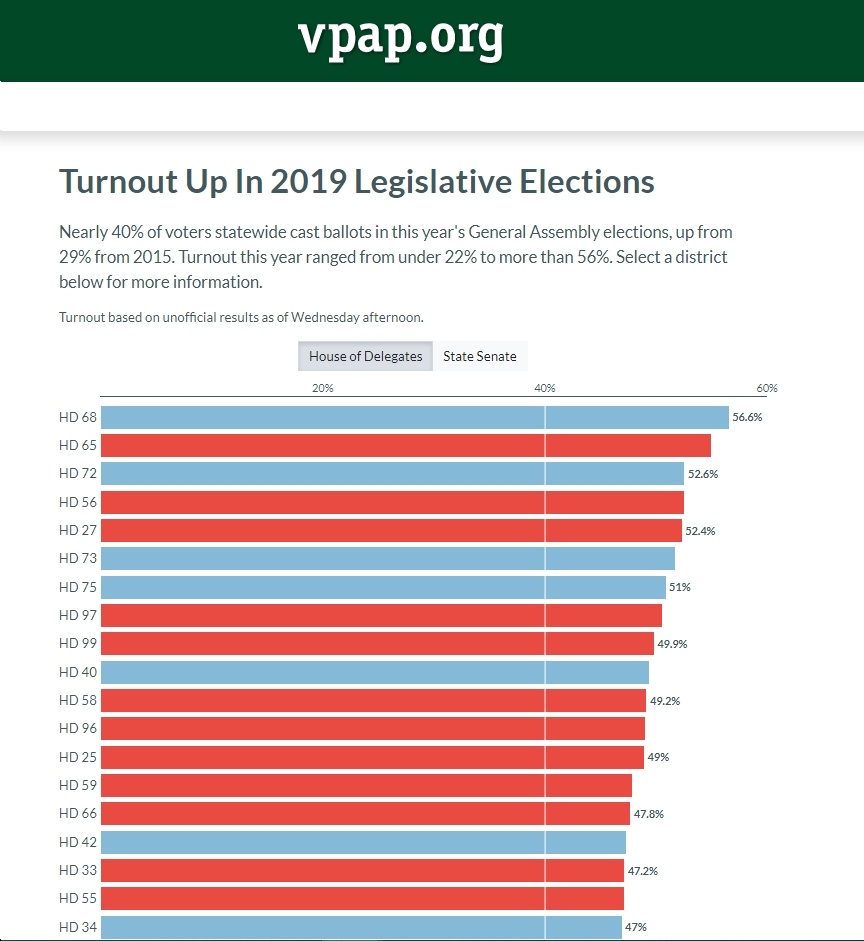
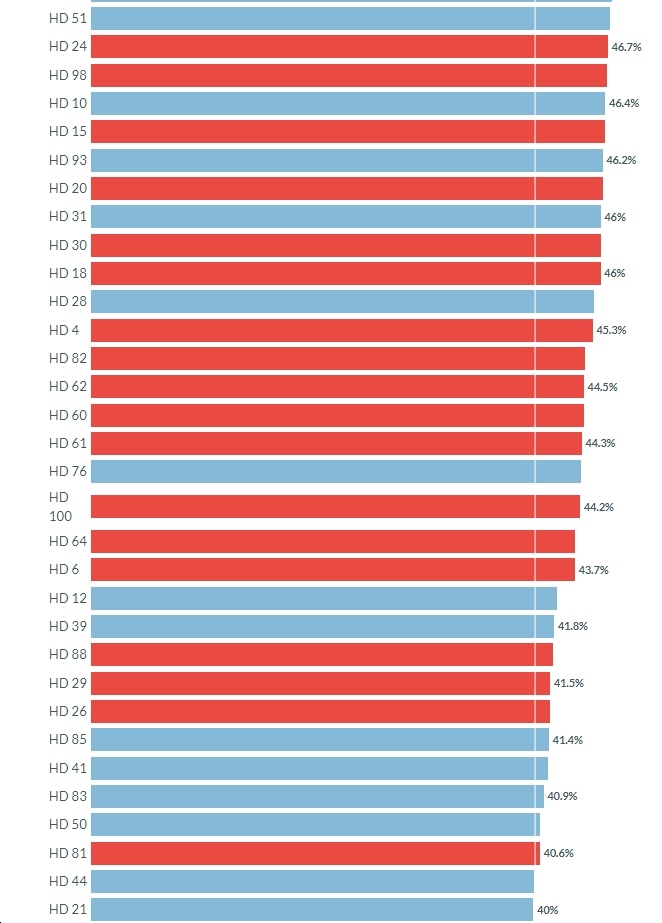
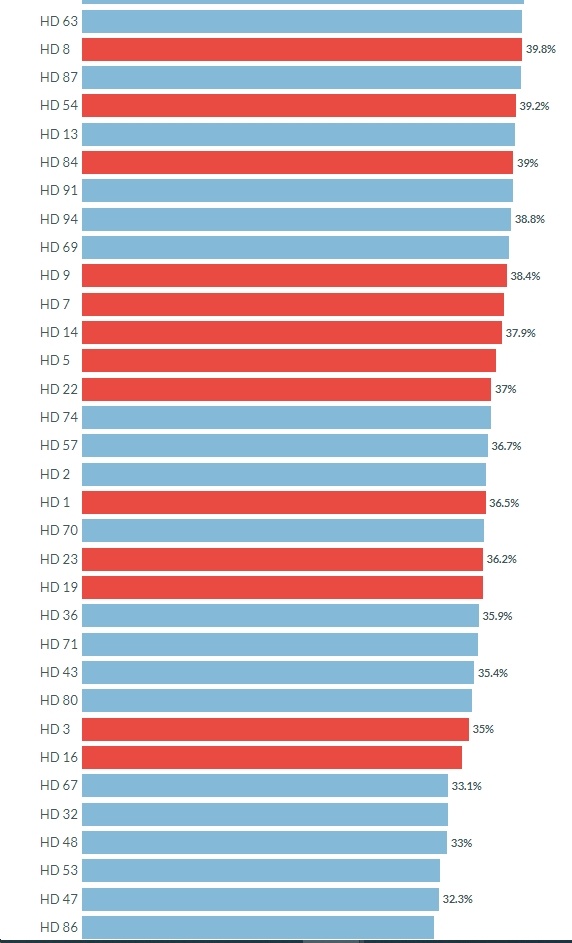
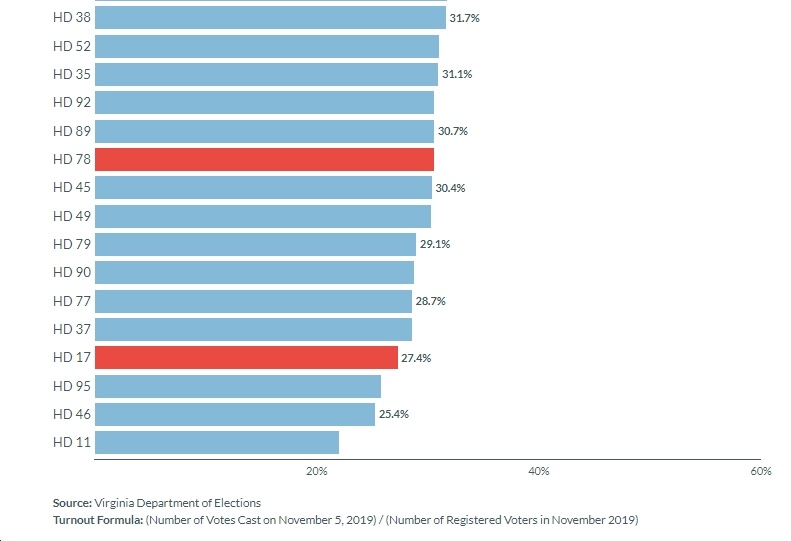
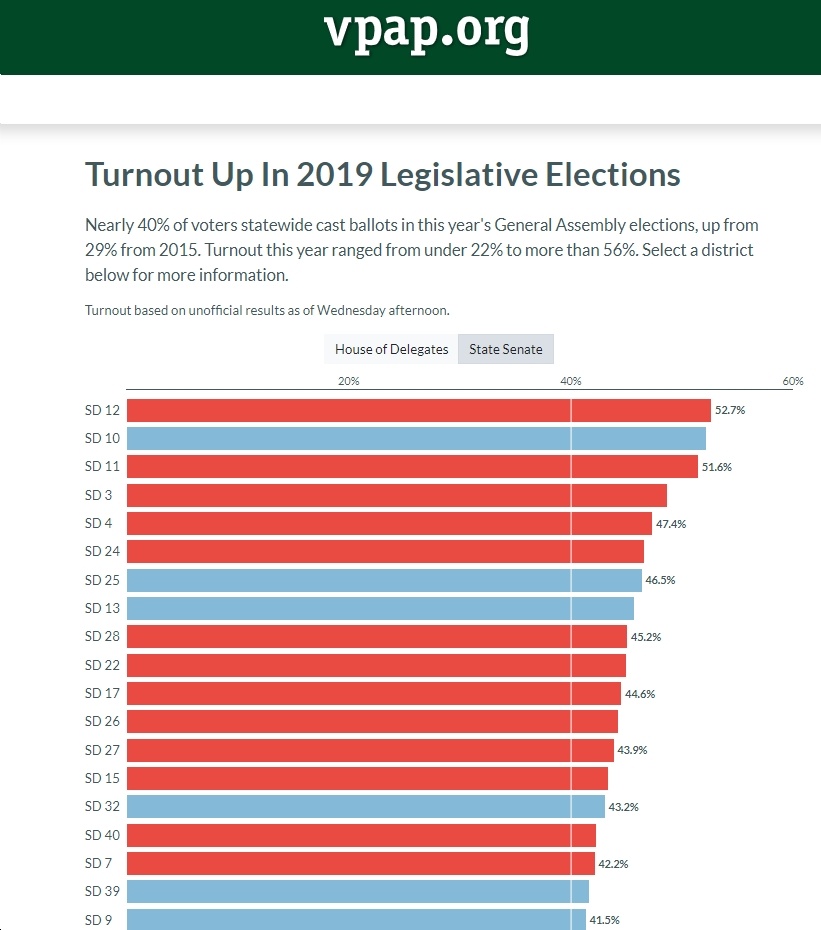
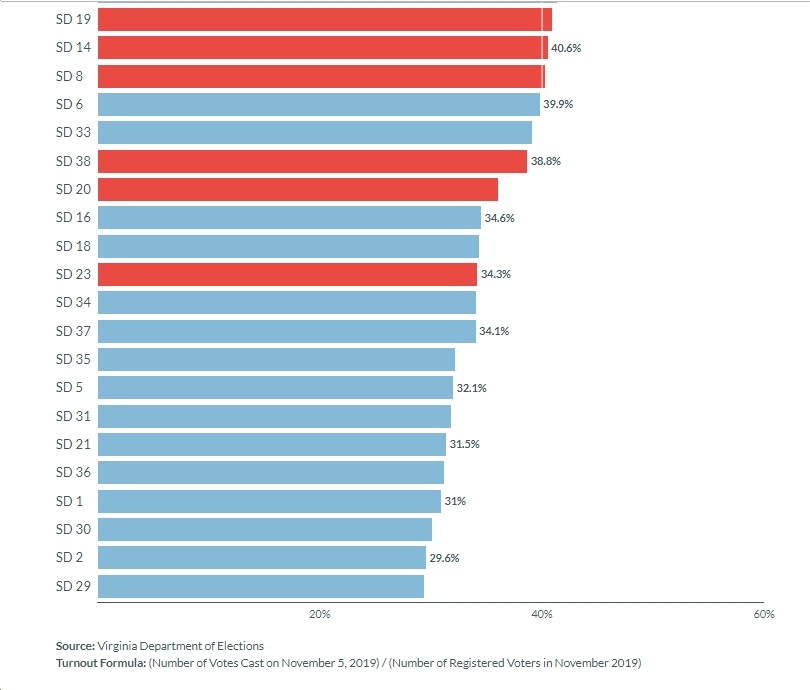
Interesting graphics from VPAP. What I find interesting it that, even though turnout overall was up sharply from the last off/odd election year in 2015, there doesn’t seem to be a positive correlation here between higher turnout and better Democratic performance. For instance, turnout in SD12 was very high, at 52.7%, yet the Republican (Siobhan Dunnavant) defeated the Democrat (Debra Rodman). Turnout was also very high in SD11, yet Republican Amanda Chase defeated Democrat Amanda Pohl. Overall, five the top six (and 13 of the top 17) highest-voter-turnout State Senate districts went to Republicans. That’s not what I would have expected. And in the House of Delegates, 10 of the top 15 (and 12 of the top 18) highest-turnout districts also went to…Republicans. On the flip side, Dems dominated the lower-turnout-percentage districts. What the heck? Any theories?
 Over and Over Again, as Cline Basically Laughs Off Trump’s Threats to Witnesses, Courts, etc. – and the Need for a “Gag Order”")