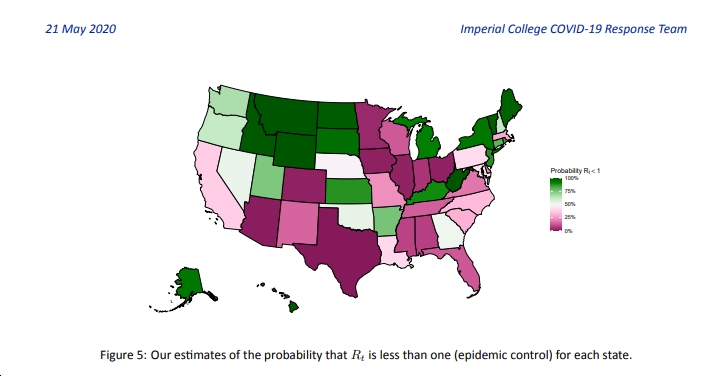
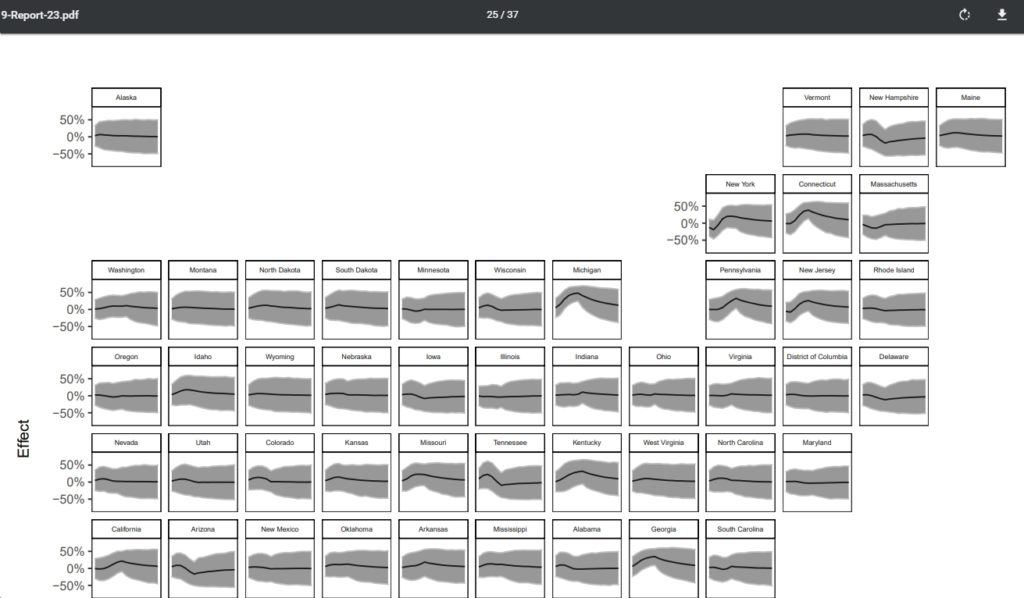
 See below for highlights, graphics and an excellent analysis by Charlottesville City Council member Lloyd Snook of this new study, by the Imperial College COVID-19 response team, “model[ing] the epidemics in the US at the state-level, using publicly available death data within a Bayesian hierarchical semi-mechanistic framework,” and “For each state…estimat[ing] the time-varying reproduction number (the average number of secondary infections caused by an infected person), the number of individuals that have been infected and the number
of individuals that are currently infectious.” Also, click on the Imperial College graphics above and below to enlarge.
Some key conclusions of the study include (bolding added by me for emphasis):
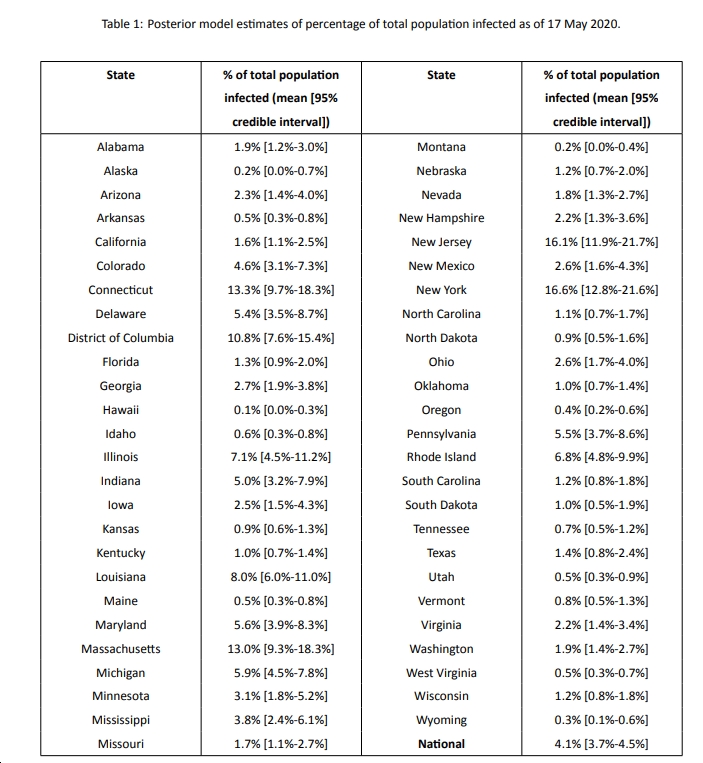
- “Nationally, our estimates show that the percentage of individuals that have been infected is 4.1% [3.7%-4.5%], with wide variation between states. For all states, even for the worst affected states, we estimate that less than a quarter of the population has been infected”
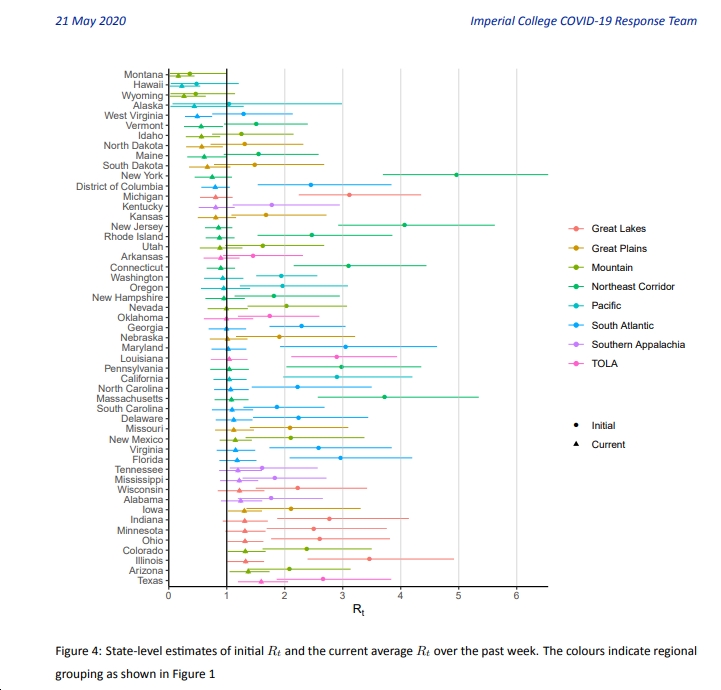
- “There is variation in the initial reproduction number, which is likely due to a range of factors; we find a strong association between the initial reproduction number with both population density (measured at the state level) and the chronological date when 10 cumulative deaths occurred (a crude estimate of the date of locally sustained transmission).”
- “Our estimates suggest that the epidemic is not under control in much of the US: as of 17 May 2020, the reproduction number is above the critical threshold (1.0) in 24 [95% CI: 20-30] states. Higher reproduction numbers are geographically clustered in the South and Midwest, where epidemics are still developing, while we estimate lower reproduction numbers in states that have already suffered high COVID-19 mortality (such as the Northeast). These estimates suggest that caution must be taken in loosening current restrictions if effective additional measures are not put in place.”
- “We predict that increased mobility following relaxation of social distancing will lead to resurgence of transmission, keeping all else constant. We predict that deaths over the next two-month period could exceed current cumulative deaths by greater than two-fold, if the relationship between mobility and transmission remains unchanged. Our results suggest that factors modulating transmission such as rapid testing, contact tracing and behavioural precautions are crucial to offset the rise of transmission associated with loosening of social distancing.”
- “Overall, we show that while all US states have substantially reduced their reproduction numbers, we find no evidence that any state is approaching herd immunity or that its epidemic is close to over.”
- For Virginia specifically, “the time-varying reproduction number, Rt, which measures transmission intensity” is above 1.0, which means the virus is continuing to spread.
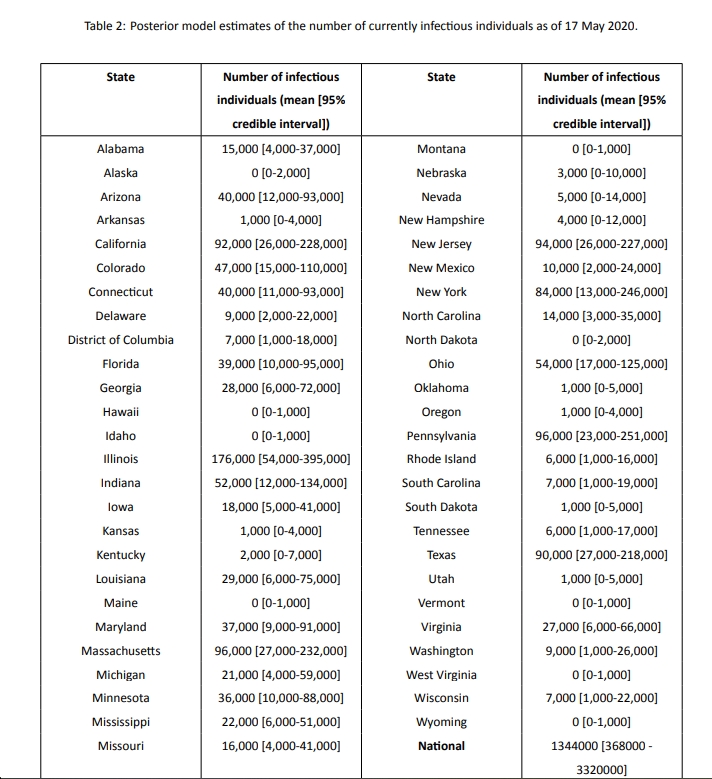
- Also for Virginia, the model estimates that approximate 2.2% of the state’s population was infected – with around 27,000 “currently infectious” – as of May 17.
- Finally, note that Virginia’s transmission intensity (Rt) was as high as 4.0 in March, before “stay-at-home” and other restrictions were imposed. After that, you can see the Rt fall sharply, then fluctuating around 1.0 since early April. The question, with Virginia entering into “Phase 1” reopening – and then possibly “Phase 2” and beyond – will Rt spike again? That’s basically what the Imperial College model is suggesting.
***************************************
And now, here’s Lloyd Snook’s analysis (bolding added by me for emphasis):
If you really want to geek out on the latest projections, this story points you to another run of the Imperial College model — https://www.imperial.ac.uk/…/2020-05-21-COVID19-Report-23.p…
The guts of this report is an effort to estimate the rate of retransmission — the “Rt” — for each state. If the Rt is below 1, you have no epidemic. If the Rt is above 1, the disease is spreading. If the Rt is around 2, you have an exploding epidemic. When it was first assessed, New York’s Rt was 5; New Jersey was over 4; Michigan, Massachusetts, and Connecticut were all over 3. Virginia’s was about 2.7. In 48 of the states, the initial Rt was above 1, meaning that in all but Montana, Hawaii, and Wyoming, the infection was uncontrolled until mid-March. Then the varying degrees of stay-at-home or social distancing orders came out, and now there is no state where the Rt is over 2, and many states where the Rt is significantly below 1. In Virginia, at the moment, they estimate our Rt at being about 1.1 to 1.2. (See p. 8 of the study for their graph of all of the states.) Texas is believed to have the highest Rt at the moment — about 1.6.
My take-aways from a policy perspective are:
1. The shut-down orders did their jobs, and don’t let people tell you that they weren’t necessary. In 48 states and the District of Columbia they were essential.
2. Although there may be some states where the shut-down orders can be lifted, Virginia is not (yet) one of them.
3. Most of the states where political pressure to reopen the economy is strongest are states that absolutely should NOT be reopening yet.
What the article does NOT discuss, but that my analysis of the statewide data in Virginia would add, is that there are wide variations within a state of the likely Rt. For example, in Accomack County, where the hottest of Virginia’s hot spots is found, the Rt would surely have been measured as recently as a week or two ago at being many times higher than the Rt in Southwest Virginia. What is necessary in a hotspot on the Eastern Shore is going to be different from what is necessary in Tazewell County, 457 miles away, where there is essentially no pandemic.




![Thursday News: “World leaders now enter the White House at their own risk”; “2 Israeli Embassy staff shot and killed in front of Capital Jewish Museum in DC”; GOP Moves to Pass “Monstrous” Bill Which “steal[s] from the poor and give[s] to the rich”](https://bluevirginia.us/wp-content/uploads/2025/05/montage0522-238x178.jpg)


