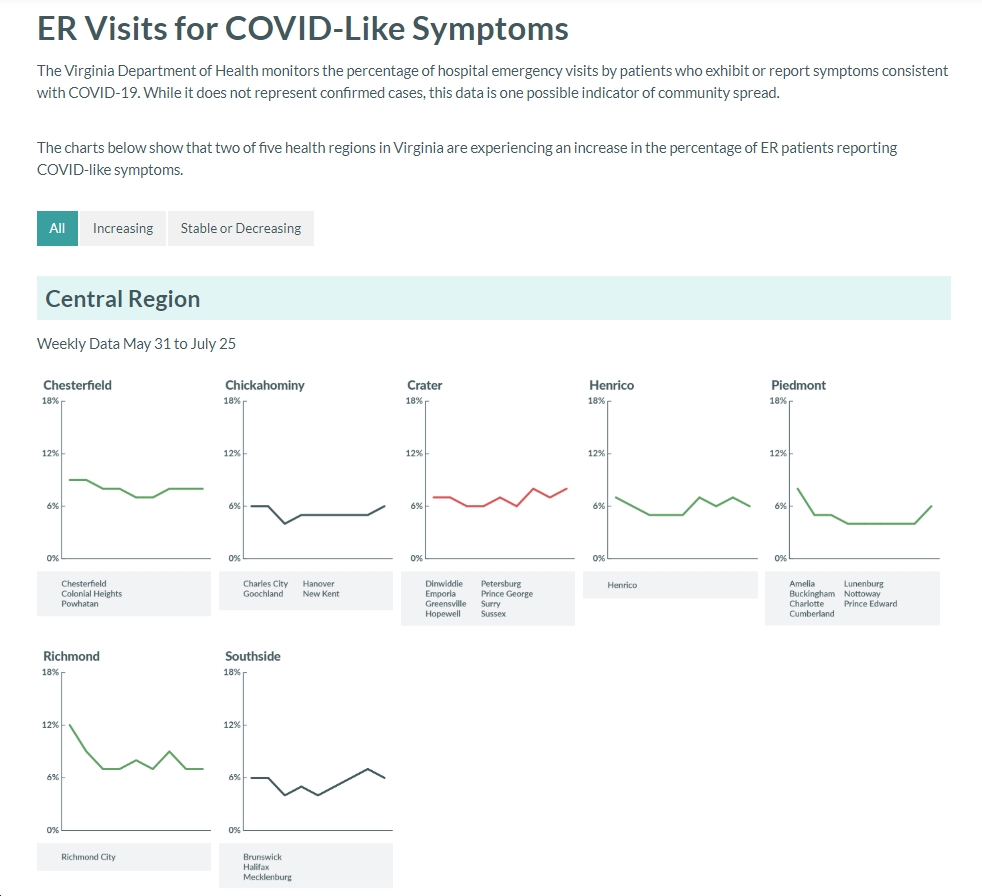
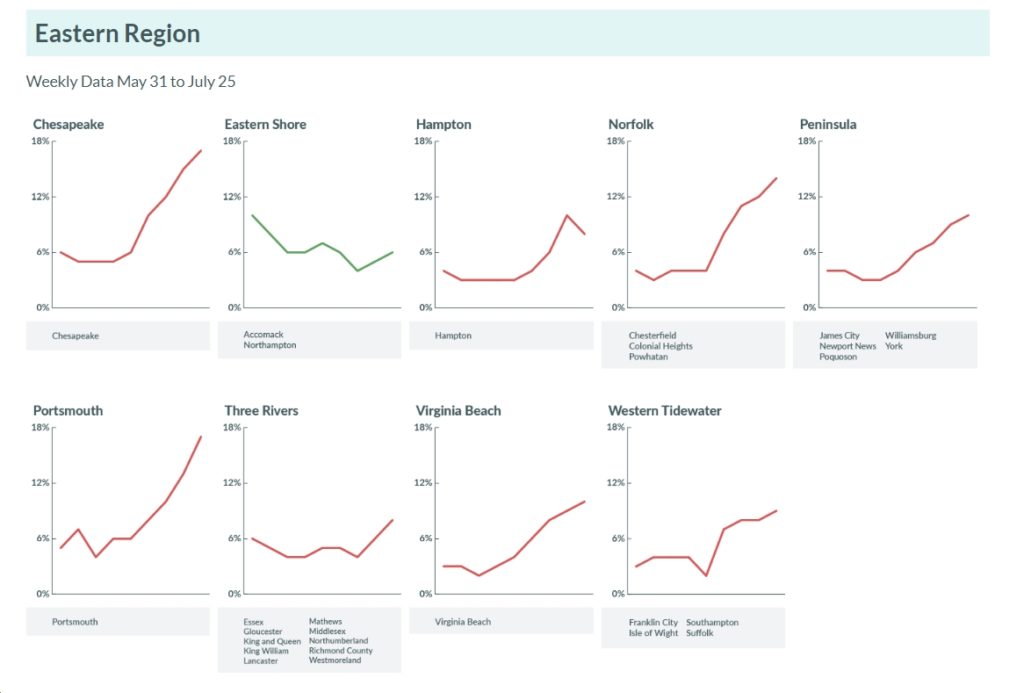
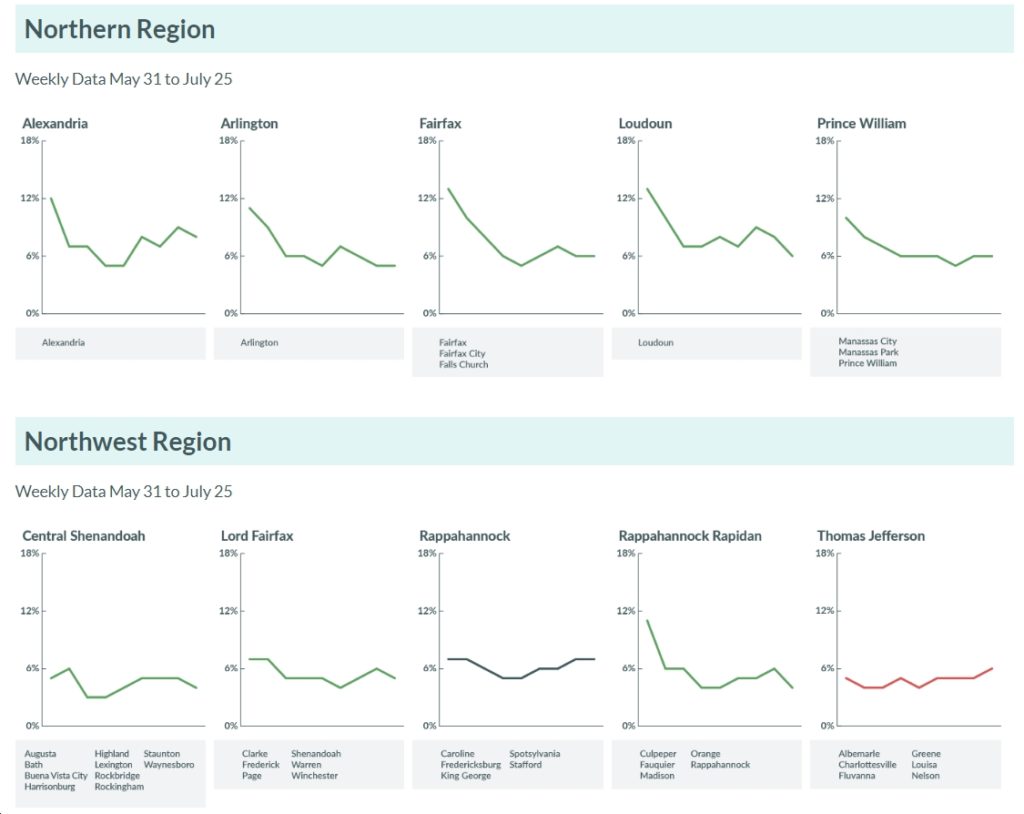
See below for some interesting, helpful graphics by VPAP on “the percent of total emergency room visits in a health district that are due to COVID-Like Illness,” and whether they have been increasing (red), decreasing (green) or showing no change (grey) since May 31. A few takeaways are:
- Two regions – Eastern and Southwest Virginia – are “experiencing an increase in the percentage of ER patients reporting COVID-like symptoms.“ The other three regions – Central, Northern, Northwest – are looking pretty good on this metric.
- The Eastern region – Chesapeake, Eastern Shore, Hampton, Norfolk, Peninsula, Portsmouth, Three Rivers, Virginia Beach, Western Tidwater – has generally seen a significantly increased “percentage of ER patients reporting COVID-like symptoms.” The only exception is Eastern Shore, which has been coming down.
- The Southwest region – Alleghany, Central Virginia, Cumberland Plateau, Lenowisco, Mount Rogers, New River, Pittsylvania-Danville, Roanoke, West Piedmont – is mostly showing red (increasing “percentage of ER patients reporting COVID-like symptoms”), with the exceptions of Lenowisco (Lee, Wise, Scott Counties plus the city of Norton – coming down somewhat) and Mount Rogers (Bland, Carroll, Grayson, Smyth, Washington and Wythe Counties, plus the cities of Bristol and Galax, etc. – steady).
- The Central region – Chesterfield, Chickahominy, Crater, Henrico, Piedmont, Richmond, Southside – has been mostly flat or declining, with the exception of Crater (Dinwiddie, Emporia, Greensville, Hopewell, Petersburg, Prince George, Surry, Sussex – increasing).
- The Northern region – Alexandria, Arlington, Fairfax, Loudoun, Prince William – has been showing a declining “percentage of ER patients reporting COVID-like symptoms.”
- The Northwest region – Central Shenandoah, Lord Fairfax, Rappahannock, Rappahannock Rapidan, Thomas Jefferson – has been mostly flat or declining, with the exception of Thomas Jefferson – increasing.


![Thursday News: “World leaders now enter the White House at their own risk”; “2 Israeli Embassy staff shot and killed in front of Capital Jewish Museum in DC”; GOP Moves to Pass “Monstrous” Bill Which “steal[s] from the poor and give[s] to the rich”](https://bluevirginia.us/wp-content/uploads/2025/05/montage0522-238x178.jpg)


![[UPDATED 1/29/26] Audio: Sen. Tim Kaine Talks to Blue Virginia About His “Five-Point Plan” to Fight Trump’s Orban-Like Assault on US Democracy; Civil Disobedience a la MLK Jr.; Trump’s Bogus “Energy Emergency”; the Crucial Importance of the 2025 VA Elections; etc.](https://bluevirginia.us/wp-content/uploads/2025/02/kaineinterview2-100x75.jpg)
