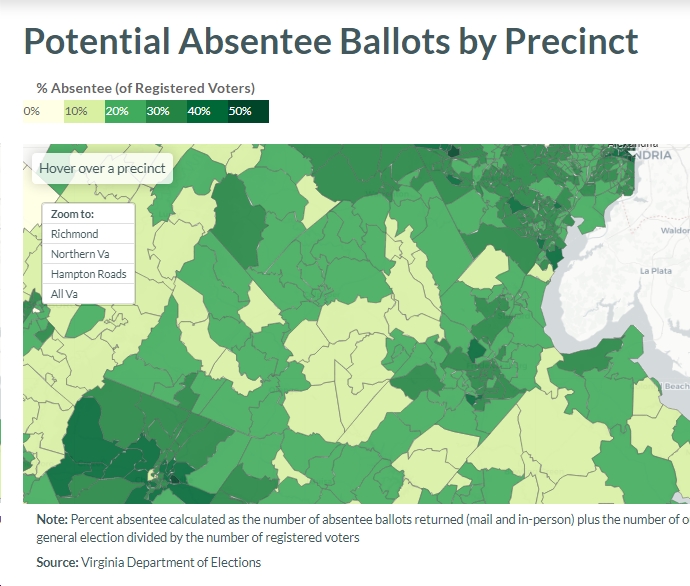
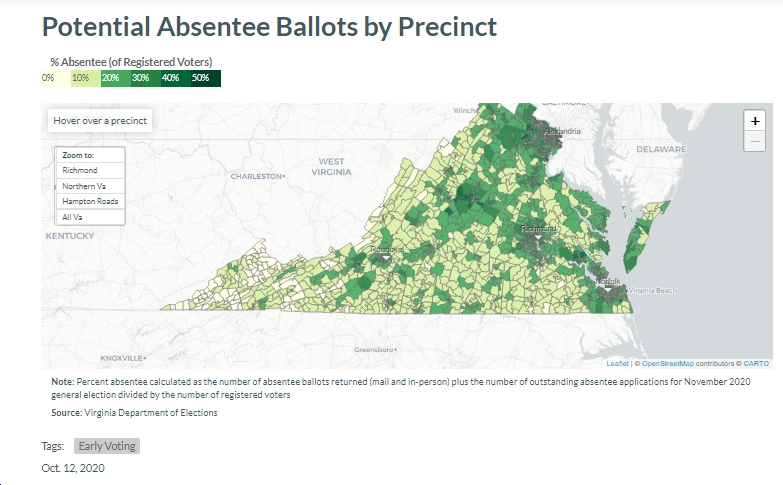
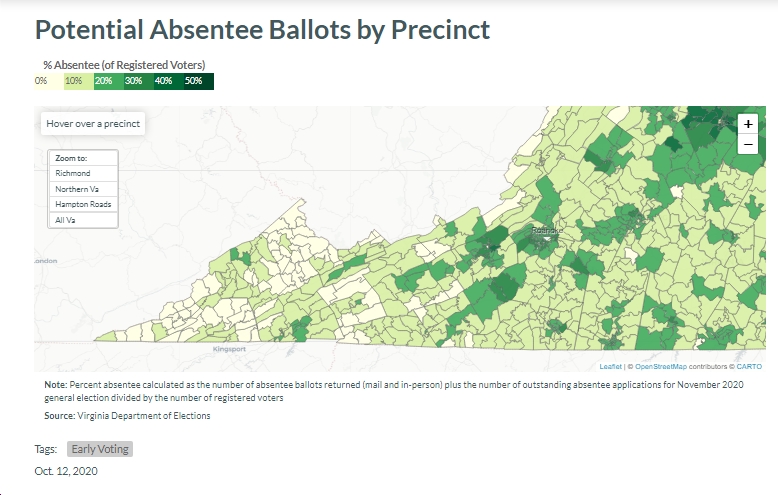
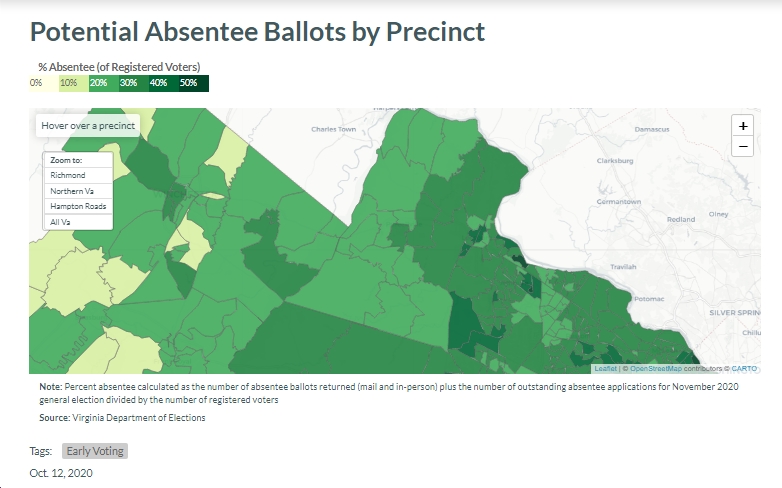
There’s an interesting new map available this morning at VPAP, showing “Percent absentee calculated as the number of absentee ballots returned (mail and in-person) plus the number of outstanding absentee applications for November 2020 general election divided by the number of registered voters.” See below for some highlights by region…
Here’s the entire state, which clearly shows that the highest % absentee ballots tend to be in the “bluest” areas of the state, particularly the “urban-suburban crescent” from Hampton Roads to the Richmond area to Northern Virginia – and also the Charlottesville/Albemarle area and Roanoke City/Blacksburg. And the lowest absentee %s are generally tend to be in the “reddest” areas of the state – southwestern Virginia, western Virginia, parts of Southside, etc. But check out the more detailed maps, below, and you’ll see it’s not always so cut-and-dried within regions.
Absentee percentages are relatively low in deep-“red” Southwestern Virginia, with single digits or teens common in Russell County, Scott County, Lee County, Buchanan County, Smyth County, Bland County, Wise County, etc.
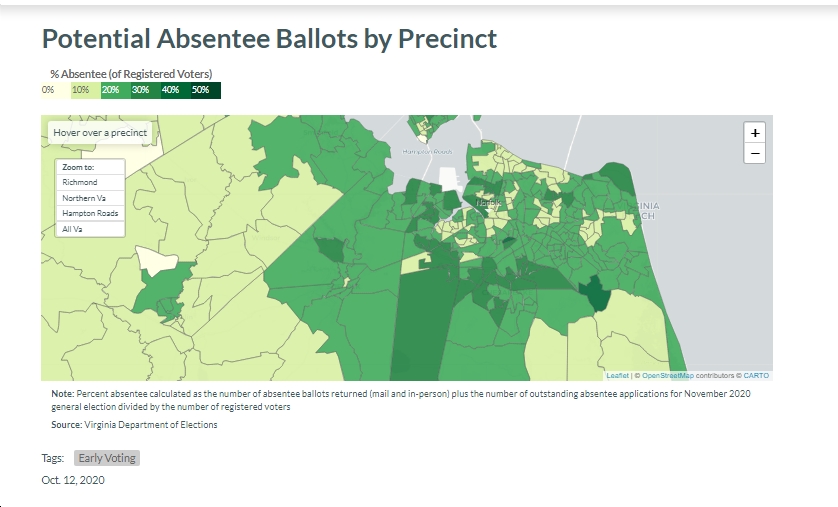
From this focus on Hampton Roads, you can see the wide variation within the region, with 40.3% absentees the Virginia Beach “Courthouse” precinct (which went 64% for Trump in 2016), but just 15.7% in the Virginia Beach “Seatack” precinct (which went 52% for Clinton in 2016), so apparently it’s not as simple as “red” precincts having low absentee percentages and “blue” precincts having high ones.
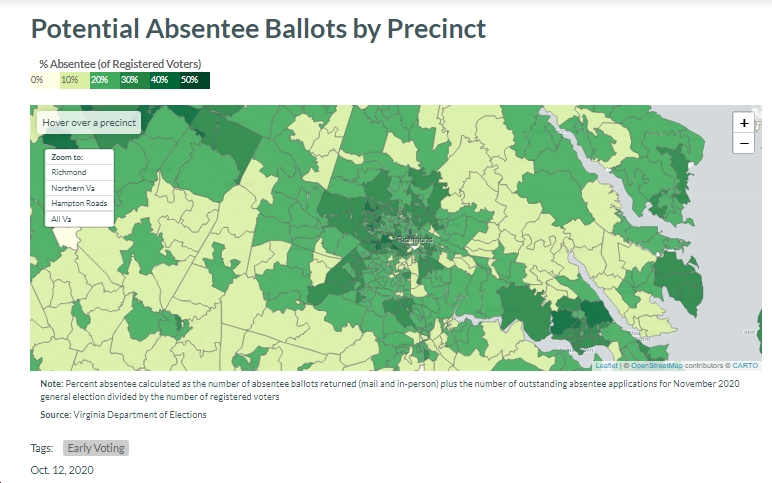
In the Richmond area, it’s a mixed bag as well, with Henrico County’s Tuckahoe precinct – which went 54% for Trump in 2016 – at 42.6% absentee, while Richmond City’s precinct 413 – which went 63% for Clinton in 2016 – is at 41.2% absentee, and Richmond City’s precinct 902 – which went 90.3% for Clinton in 2016 – is at just 15.4% absentee. In Chesterfield County, the Iron Bridge Precinct – which went 51% for Trump in 2016 – is at 33.3% absentee, while Bird Precinct – which went 56% for Trump in 2016 – is at 18.0% absentee.
In deep-“blue” Arlington, Alexandria and Falls Church, absentee percentages are generally in the 30%s and 40%s, reaching as high as 52.1% in Arlington’s Dominion Hills precinct and 52.2% in Thrifton precinct; 54.3% in Alexandria’s George Mason School precinct; and 57.9% in Falls Church’s Third Ward precinct. In “blue” Fairfax County, generally the highest absentee percentages appear to be along the Orange Line and Silver Line Metro corridors – in Vienna (around 40%), Wolf Trap (40.2%), Kilmer (38.8%), etc., while the lowest absentee percentages are in southern Fairfax County — Gunston (23.3%), Woodlawn (22.8%), Lynbrook (20.7%), Edsall (24.2%), Lorton (24.3%), etc. and in Herndon (around 28%) in the western part of the county.
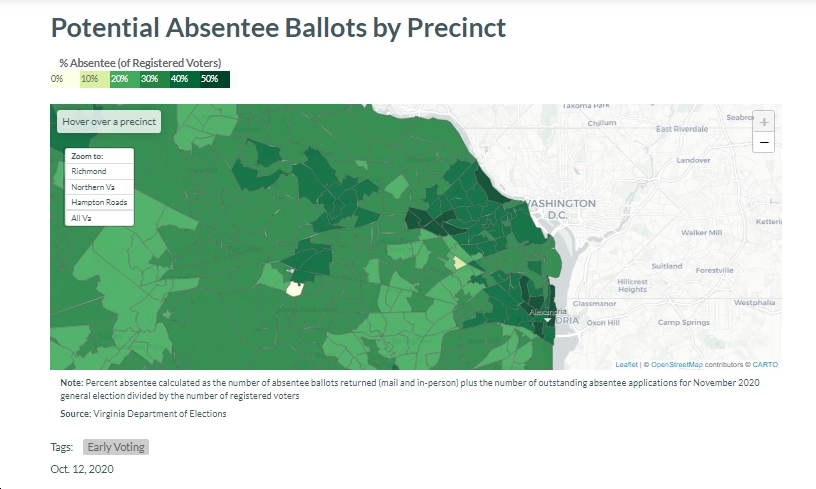
In Loudoun County, absentee percentages range from as high as 53.8% in Belmont Ridge precinct (which went 53% for Clinton in 2016) to as low as 23.6% in Aldie precinct (which went 50.1% for Trump in 2016) and 20.8% in Between the Hills precinct (which went 59.3% for Trump in 2016). In general, percentages appear to be higher in the more densely populated eastern part of the county, somewhat lower in the more rural/exurban/western parts.
In Prince William County, the highest absentee percentages are in Alvey (64.8%), Heritage Hunt (59.9%), Washington-Reid (46.1%), Battlefield (45.0%), Marsteller (42.0%) and Penn (41.6%). Note that Alvey went 50.8% for Trump in 2016, Heritage Hunt went 53.4% for Trump, Battlefield went 58.0% for Trump and Penn went 54.2% for Trump, while Marsteller went 50.0% for Clinton and Washington-Reid went 53.0% for Clinton. The lowest absentee percentages are in Brentsville (23.6%), which went 69% for Trump in 2016; Lynn (24.0%), which went 77.4% for Clinton in 2016; Westgate (25.6%), which went 46.8% for Clinton in 2016. So…kind of a hodgepodge, really.