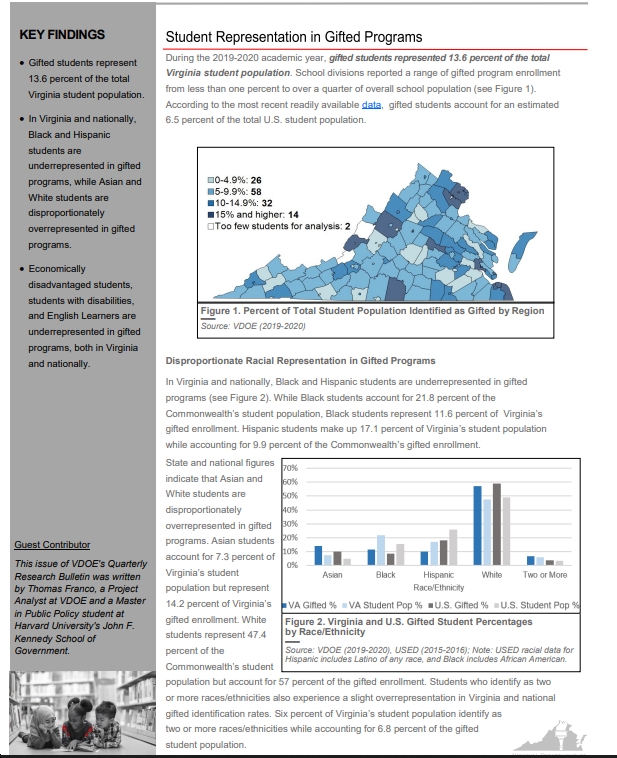
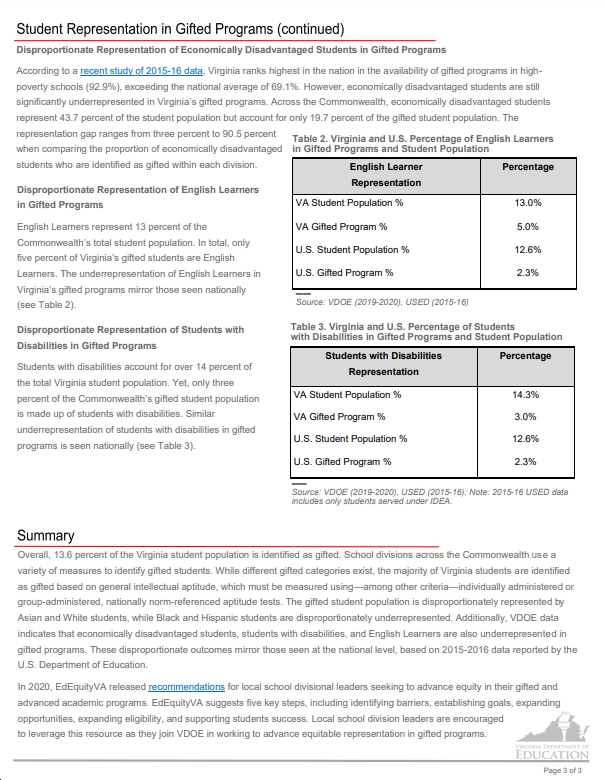
See below for a new report from the Virginia Department of Education on “Gifted Education” in Virginia. A few key takeaways are:
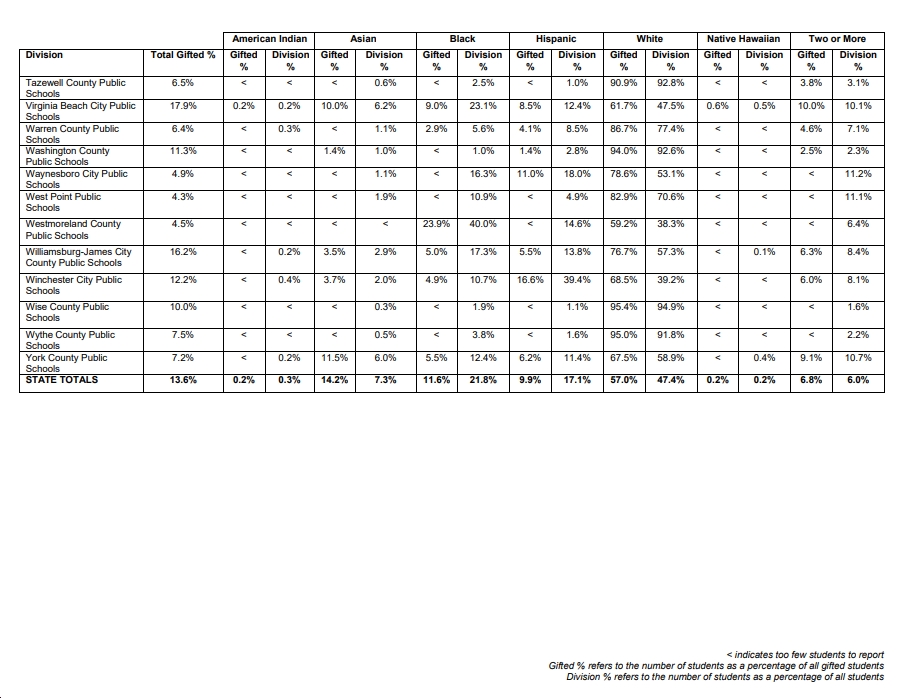
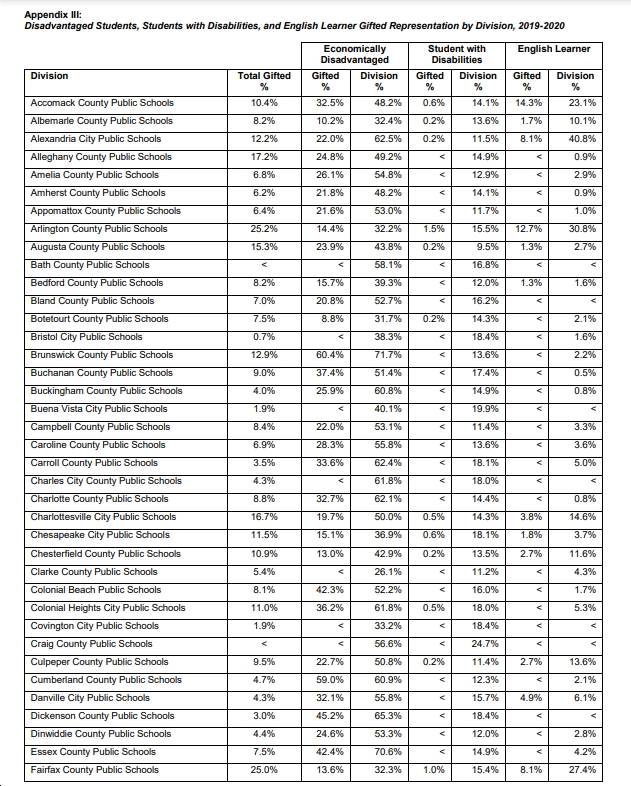
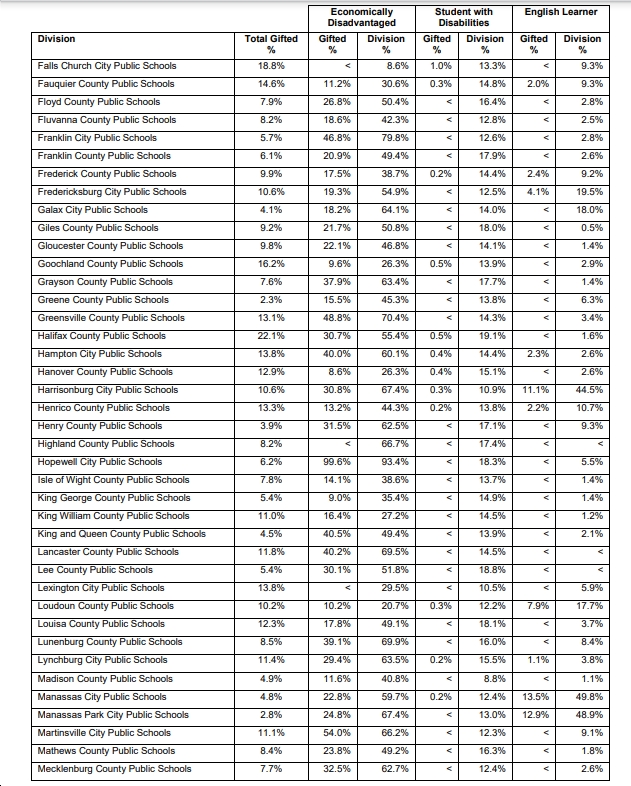
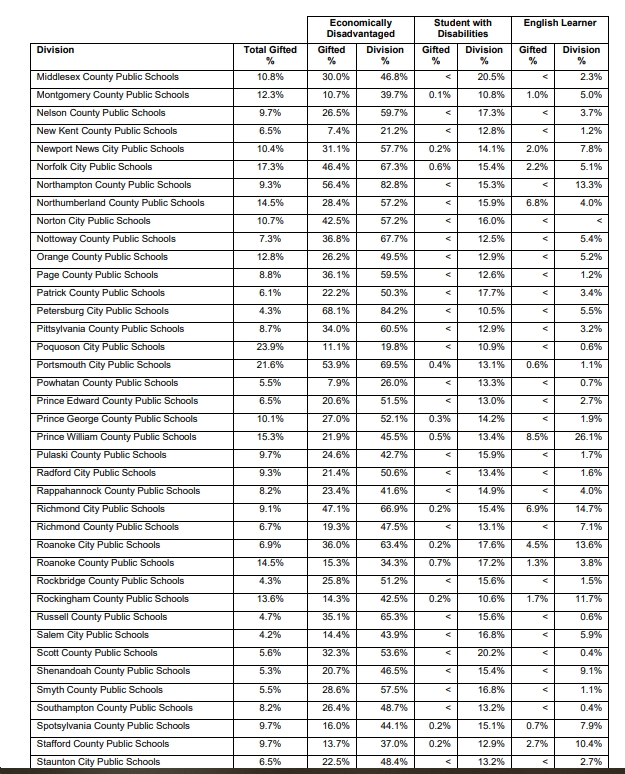
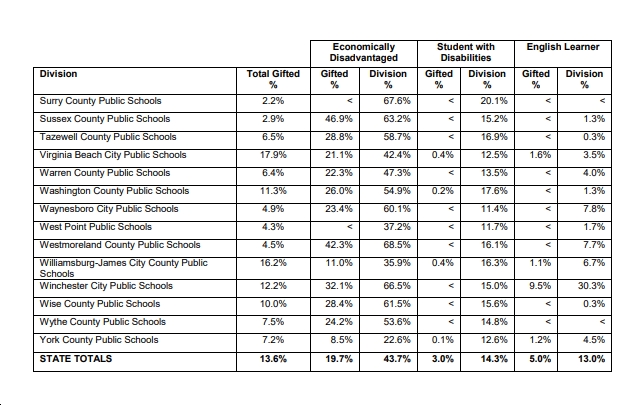
- “During the 2019-2020 academic year, gifted students represented 13.6 percent of the total Virginia student population. School divisions reported a range of gifted program enrollment from less than one percent to over a quarter of overall school population (see Figure 1). According to the most recent readily available data, gifted students account for an estimated 6.5 percent of the total U.S. student population.”
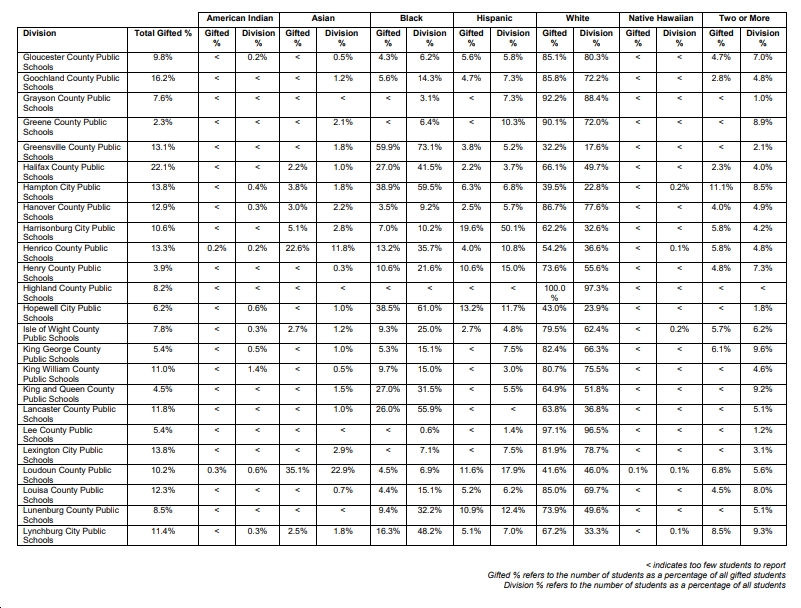
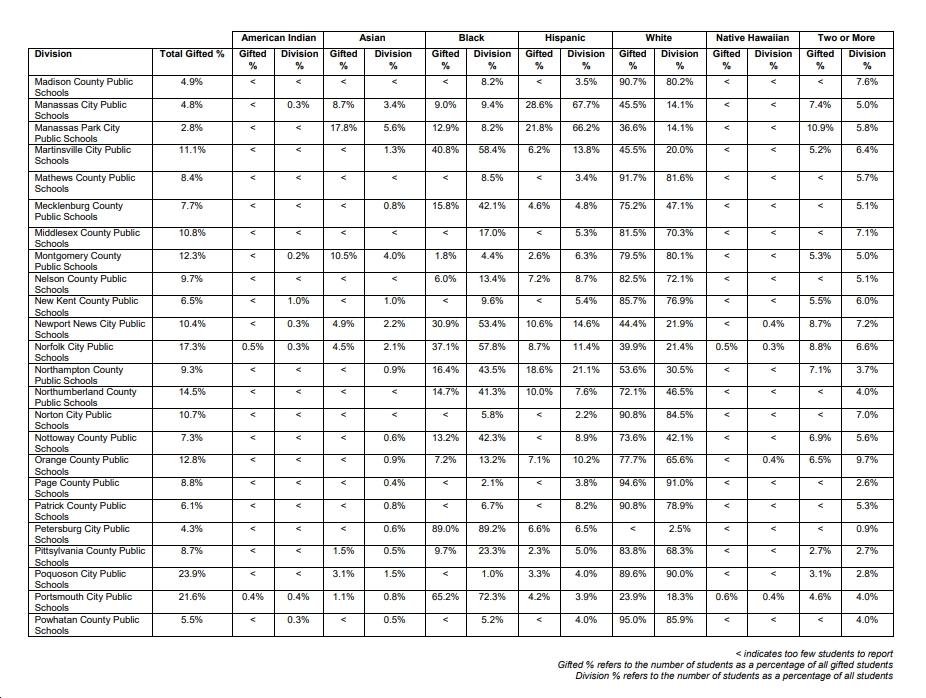
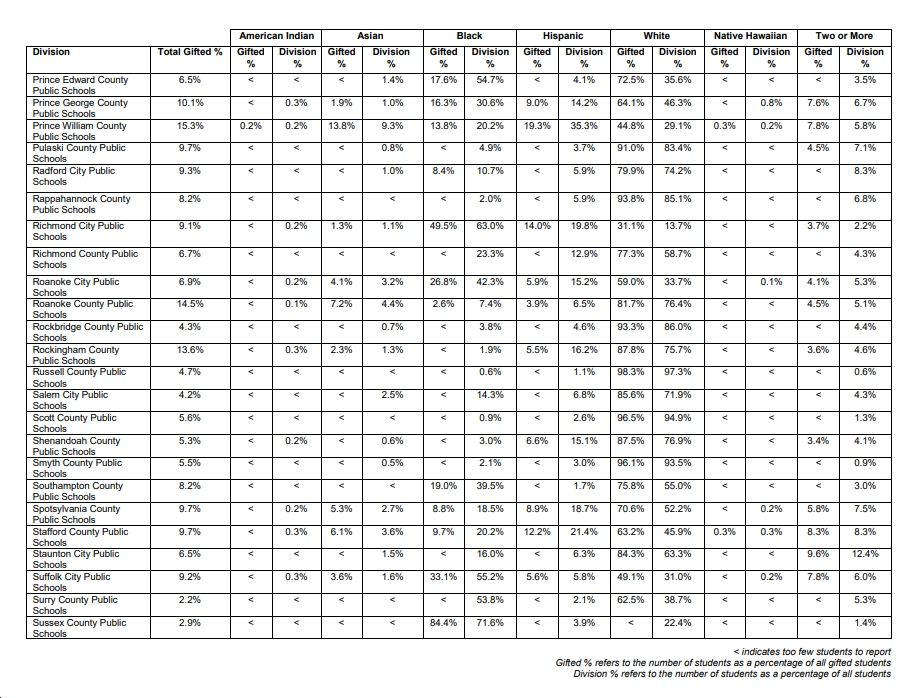
- “In Virginia and nationally, Black and Hispanic students are underrepresented in gifted programs (see Figure 2). While Black students account for 21.8 percent of the Commonwealth’s student population, Black students represent 11.6 percent of Virginia’s gifted enrollment. Hispanic students make up 17.1 percent of Virginia’s student population while accounting for 9.9 percent of the Commonwealth’s gifted enrollment. State and national figures indicate that Asian and White students are disproportionately overrepresented in gifted programs. Asian students account for 7.3 percent of Virginia’s student population but represent 14.2 percent of Virginia’s gifted enrollment. White students represent 47.4 percent of the Commonwealth’s student population but account for 57 percent of the gifted enrollment. Students who identify as two or more races/ethnicities also experience a slight overrepresentation in Virginia and national gifted identification rates. Six percent of Virginia’s student population identify as two or more races/ethnicities while accounting for 6.8 percent of the gifted student population.”
- “Across the Commonwealth, economically disadvantaged students represent 43.7 percent of the student population but account for only 19.7 percent of the gifted student population“
- “English Learners represent 13 percent of the Commonwealth’s total student population. In total, only five percent of Virginia’s gifted students are English Learners“
- “Students with disabilities account for over 14 percent of the total Virginia student population. Yet, only three percent of the Commonwealth’s gifted student population is made up of students with disabilities“
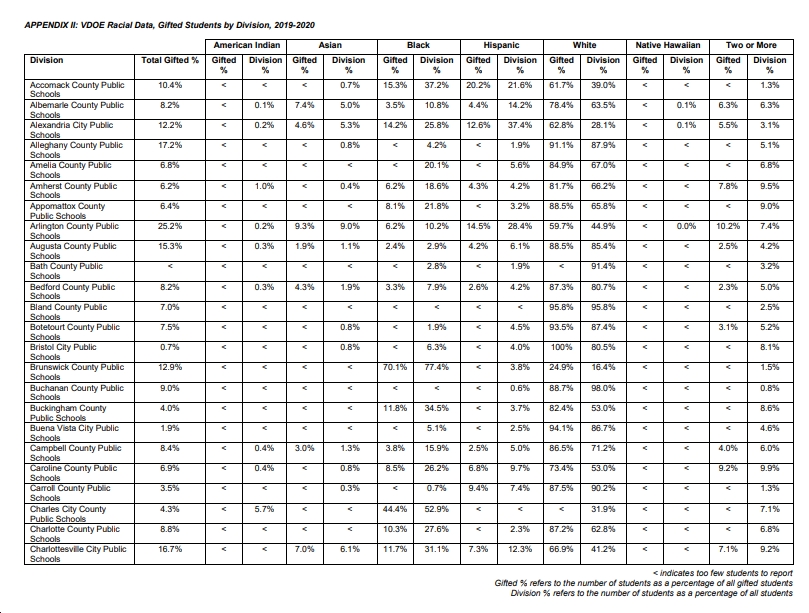
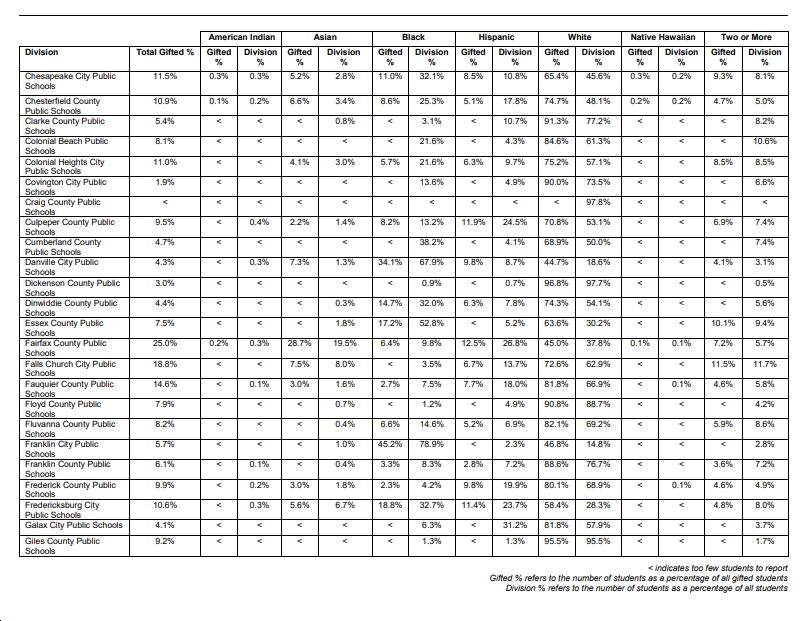
- Some major jurisdictions with large racial disparities in gifted programs include: Fairfax County (Hispanic students make up 26.8% of students, but just 12.5% of gifted students); Prince William County (Hispanic students make up 35.3% of students in the division, but just 19.3% of gifted students); Virginia Beach (Black students make up 23.1% of students in the division, but just 9.0% of gifted students); Richmond City (White students make up 13.7% of students in the division, but 31.1% of gifted students); Henrico County (Black students make up 35.7% of students in the division, but just 13.2% of gifted students); Chesterfield County (Black students make up 25.3% of students in the division, but just 8.6% of gifted students); Charlottesville (Black students make up 31.1% of students in the division, but just 11.7% of gifted students); Manassas City (Hispanic students make up 67.7% of students in the division, but just 28.6% of gifted students); Lynchburg (Black students make up 48.2% of students in the division, but just 16.3% of gifted students); Arlington County (Hispanic students make up of 28.4% of students in the division, but just 14.5% of gifted students); etc. Sensing a pattern here?




![[UPDATED 1/29/26] Audio: Sen. Tim Kaine Talks to Blue Virginia About His “Five-Point Plan” to Fight Trump’s Orban-Like Assault on US Democracy; Civil Disobedience a la MLK Jr.; Trump’s Bogus “Energy Emergency”; the Crucial Importance of the 2025 VA Elections; etc.](https://bluevirginia.us/wp-content/uploads/2025/02/kaineinterview2-100x75.jpg)

