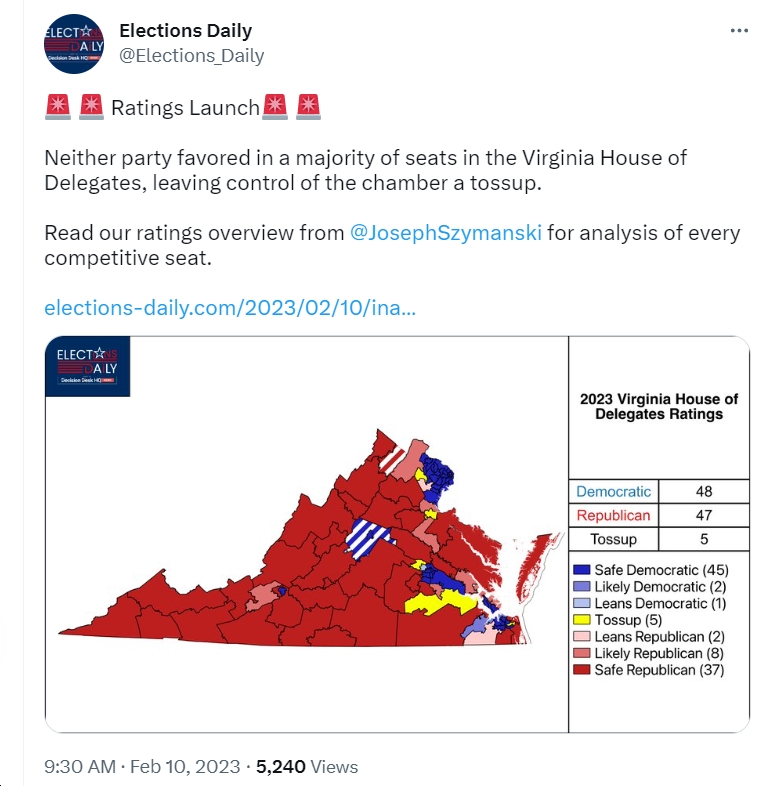
The other day, we got the inaugural Virginia State Senate 2023 elections analysis from Elections Daily. Today, they followed that up with their House of Delegates 2023 elections analysis. Overall, as far as I can tell, the analysis seems about right, with control of the Virginia House of Delegates pretty much a tossup at this point (and with which seats are the most competitive not a great mystery). For some perspective/contrast, check out Looking Ahead to the Crucial 2023 Virginia General Assembly Elections: VPAP Breaks Down the 2022 Midterm Results by VA House of Delegates, State Senate Districts:
VPAP’s analysis finds that the House of Delegates, also based on the 2022 midterm results, has 39 “Strong D” seats, 11 “Lean D,” 10 “Competitive,” 15 “Lean R” and 25 “Strong R.” So, again, if 2023 turnout patterns are similar to the 2022 midterms, that would likely equate to 50 Democratic seats, 40 Republican seats and 10 tossups…so as many as 60 Democratic seats if we can win them all, but more likely in the 50-55 range if we win between zero and five of the ten tossups).
In contrast, Elections Daily has it at 45 “Safe Democratic” seats, 2 “Likely Democratic,” 1 “Leans Democratic,” 5 “Tossup,” 2 “Leans Republican,” 8 “Likely Republican” and 37 “Safe Republican” seats. Add those up and you get 48 Safe/Likely/Leans Democratic seats vs. 47 Safe/Likely/Leans Republican seats, with 5 Tossups. That’s not quite as optimistic for Democrats as the VPAP analysis, although of course the VPAP analysis is based on assuming “2023 turnout patterns are similar to the 2022 midterms,” which…who knows if that will be the case?
Looking more closely at the “Elections Daily” analysis, I mostly think it’s fine, but the bottom line is that it’s really all going to come down to whether Democrats or Republicans have the higher voter intensity/turnout. Because the fact is, in these off/odd-year elections, with no statewide races on the ballot, turnout is usually REALLY low. For instance, per the VA Department of Elections, turnout in 2019 was 42.4% (compared to 75.1%in 2020) and just 29.1% in 2015, 28.6% in 2011 and 30.2% in 2007. Now hopefully, in the post-Dobbs era, with the Republican Party having lurched to the extremist/MAGA right (and thus posing a GRAVE threat to our rights and our very democracy), voter apathy won’t be like it was pre-2019. But even in 2019, that wasn’t exactly superb turnout. So then it comes down to which “side” (R or D) “drops off” more, or whether they drop of proportionately…or what.
Anyway, the bottom line is that there are something like 82 “safe” Republican or Democratic seats (wait, wasn’t the vaunted VA redistricting amendment supposed to make more districts competitive? LOL!) in the “Elections Daily” analysis, with another 18 or so competitive to one degree or the other (in VPAP’s analysis, there are 10 “competitive” and 26 “lean” R or D). Currently, of course, Republicans control the House of Delegates by just a narrow 52-48 margin (after Democrats controlled it 55-45 for 2020-2021), so it most definitely can and *must* be won back by the “blue team” this year…and all of these analysis confirm that fact. So bottom line, let’s make sure we all vote and stop Glenn Youngkin’s far-right plans dead in their tracks!


![CNU Wason Center Poll of Virginia: Trump Approval at Just 34%; “narrow majority support a constitutional [redistricting] amendment”](https://bluevirginia.us/wp-content/uploads/2026/01/wason0128-1-238x178.jpg)


