 Yesterday, there was a special election in Texas’ 6th Congressional District (suburban Dallas-Forth Worth) following the death from COVID-19 of Rep. Ron Wright (R) on February 7. The results were that Republicans finished #1 (Susan Wright with 19.2% of the vote) and #2 (Jake Ellzey with 13.8% of the vote) in the “jungle primary” (with candidates from both parties running in the same election), and with the top Democrat finishing #3 (Jana Lynne Sanchez with 13.4% of the vote). Total turnout was 78,374, including 48,554 Republican voters (63%) and 28,952 Democratic voters (37%).
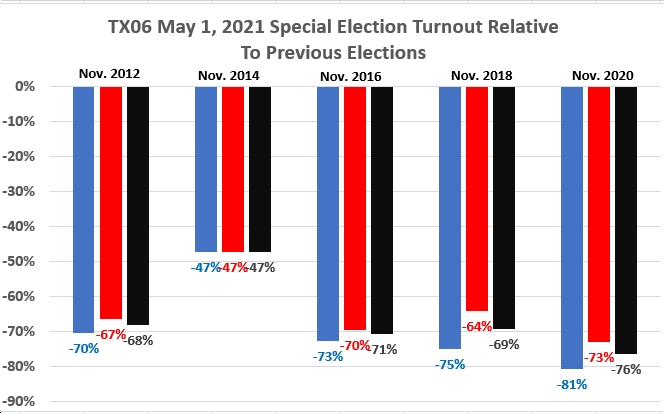
As you can see from the graphic (click to enlarge), turnout yesterday was down 70% overall compared to November 2020, with an 81% drop among Democrats and a 73% falloff among Republicans. Turnout was also much lower than in previous November elections – which is not surprising, of course – with generally a smaller relative dropoff in Republican voters compared to Democratic voters. It’s interesting that the dropoff in yesterday’s special election was relatively similar among Democratic and Republican voters compared to November 2012 (-70% among Dems, -67% among Rs); November 2014 (-47% among both Dems and Rs); and November 2016 (-73% among Dems, -70% among Rs), but relatively worse among Dems compared to November 2018 (-75% among Dems, -64% among Rs) and November 2020 (-81% among Dems, -73% among Rs). This could reflect the fact that Democratic turnout was higher during the anti-Trump “resistance” years, and now if falling back to more “normal,” pre-Trump turnout rates.
Note that this district is R+6 “Partisan Voting Index” (PVI) according to the Cook Political Report, while this election saw Republicans ahead by 27 points. So obviously, Democrats didn’t perform very well in this one. The question is whether this special election on a Saturday in early May in one congressional district (TX06) is an outlier, or whether we should be worried that it’s an indication of lower turnout and enthusiasm among Democratic voters, post-Trump, more broadly. Here are a few thoughts on this question.
- According to a recent article on this subject by Sabato’s Crystal Ball, special elections “can operate as a miniature version of regular midterm House elections, which often deliver setbacks to the president’s party,” BUT “they do not always operate this way, and special elections can sometimes be deceptive bellwethers for the approaching regular election.” Still, “special House elections more often break against the party in power”; “they can be a preview of the upcoming November general election” (but “don’t just pay attention to the winners of these races — pay attention to the margins, too”); “sometimes specials are not a preview.” Clear…as mud? LOL
- Another special election for U.S. House in 2021 was held in LA05 (an R+17 district) back on March 20th. Turnout in that election was 103,616, with the winner – Republican Julia Letlow – receiving 64.9% of the vote, and the runner up – Democrat Candy Christophe – receiving 27.3% of the vote. That turnout was almost exactly one-third of the 309,556 votes cast in November 2020 – obviously a huge dropoff – with the Democratic candidates going from about 100,000 votes in November 2020 to just 28,255 votes on March 20, 2021, a dropoff of about 72%. As for Republicans, their vote total dropped off 64%, so again…a big dropoff, but not quite as big as the Democratic dropoff.
- Here in Virginia, there’s not much to go on. Recently, there was a special election in deep-red SD38, with turnout of 23,667 votes — 18,082 for the Republican candidate (Travis Hackworth) and 5,585 for the Democratic candidate (Laurie Buchwald). In the 2019 general election, which was not contested by the Democrats, turnout was 47,169, or about twice the 3/23/21 special election. There was also a special election here in August 2014, with total turnout of 29,367 — 17,496 for the Republican candidate (Ben Chafin), 9,354 for the Democratic candidate (Mike Hymes) and 2,517 for moderate independent Rick Mullins. So turnout in March 2021 was over 5,000 votes lower than in August 2014, with the Republican candidate getting close to the same number of votes (slightly higher for Hackworth in 2021 than for Chafin in 2014), and with the Democratic candidate falling off significantly and no independent this time.
- There were also two special elections for House of Delegates – in HD02 and HD90 – held on January 5, 2021. The problem with looking at turnout in these elections is that they were in the middle of the holidays, a pandemic, Trump’s craziness, the Georgia special elections, etc, etc…. and with people’s minds most certainly not focused on these House of Delegates races. In the end, Democrats won both of these, but turnout was VERY low in both: 8,509 in HD02 and 5,771 in HD90, down sharply from 19,391 in HD02 in November 2019 (between Democrat Jennifer Carroll Foy and Republican Heather Mitchell) and 12,584 votes case in HD90 (an uncontested election) in November 2019. Also note that while Carroll Foy won with 60.6% of the vote (11,828 votes) in November 2019, Democrat Candi King only received 51.5% of the vote (4,386 votes) on January 5, 2021, while Republican Heather Mitchell received 48.4% of the vote (4,123 votes) on January 5, 2021, compared to her 7,563 votes in November 2019. And in HD90, Democrat Angelia Williams Graves received 3,668 votes, down from Del. Joe Lindsey’s 12,584 votes in November 2019, while her Republican opponent Sylvia Bryant received 2,103 votes (again, Republicans didn’t contest this seat in November 2019). So…it does seem like Democratic turnout fell sharply, both in absolute and relative terms, in January 2021 compared to November 2019. Which is kind of concerning on one level, but again, there were major confounding variables at work (e.g., basically snap elections in the middle of the winter holidays, etc.), so it’s hard to get a clean read.
So…what’s the bottom line here? It’s hard to say with a lot of confidence, but I’ll leave it with some thoughts from what I wrote back in early December 2020:
Sensing a pattern here? Pre-Trump, Virginia Democrats mostly turned out in presidential election years, with very low turnout in off/odd-year elections for the General Assembly, and not necessarily great turnout in “mid-terms” either. During the Trump presidency, Virginia Democrats turned out in droves, and as the saying goes, “when we vote, we win.” So…what’s next? Post-Trump, will turnout fall back closer to how it was pre-Trump? If so, will the dropoff in voter turnout be symmetrical between parties, or will one or the other see a greater dropoff? Whatever the answer is, it will have enormous implications in 2021 and beyond for:
-
-
- which party controls the Virginia House of Delegates (and in 2023, the State Senate as well)
- whether Democrats are able to hold on to “swing”/”purple” districts like VA02 and VA07
- whether Democrats are able to sweep all three statewide offices, and if so by strong or weak margins?
-
I’d also really look at what turnout is like for Democrats in on June 8th. Recall that in June 2017, we got an early indication of the strength of anti-Trump backlash, as Democratic primary turnout (542,816 for either Ralph Northam or Tom Perriello) swamped Republican primary turnout (365,762 for either Ed Gillespie, Corey Stewart or Frank Wagner). This time around, there won’t be an apples-to-apples comparison, because Republicans are holding an “unassembled convention” (with supposedly around 53,000 delegates) on May 8 to select their nominees, but still, we’ll be able to compare Democratic turnout in June 2017 to June 2021, if nothing else. And that might finally start to tell us something regarding whether, post-Trump, Virginia Democrats’ enthusiasm for being involved in the political process, including as activists and of course as voters, hold steady, falls a bit, or drops like a stone. For the sake of our futures, we’d better hope that the last option is not the case, particularly if Republicans stay enthused/energized with Joe Biden, not Donald Trump, in the White House.


![Monday News: Trump’s Lunacy Pushes China, Russia, India, etc. Together; “Happy Labor Day. Donald Trump and Elon Musk Are Screwing Workers.”; “Where is the [media’s] intense focus on Trump’s failing health?”; ““Trump says he is not a dictator. Isn’t he?”](https://bluevirginia.us/wp-content/uploads/2025/09/montage0901-238x178.jpg)


