I posted last Sunday on absentee voting ballots requested/submitted as of October 4. Now, the Virginia State Board of Elections website has numbers through October 12. Here are a few key points and graphics.
As of October 12, there were 134,806 total absentee applications, with 48,281 returned (26,468 in person and 21,778 by mail).
Now, see below for a graph of Virginia absentee ballots by Congressional District (in descending order) as of October 12.
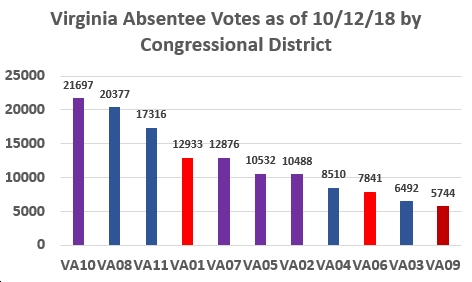
- As was the case last week, the highest number of absentee voting ballots requested/submitted to date (21,697) is in VA-10, which of course is one of the most hotly contested House races in the country, between incumbent Barbara “Trumpstock” (R) and Democratic nominee Jennifer Wexton.
- Also as was the case last week, the second highest number of absentee voting ballots requested/submitted (20,377) so far is in VA-08, a HEAVILY “blue” district (Arlington, Alexandria, Fairfax) that doesn’t even have a competitive House race, as Rep. Don Beyer (D) should romp. So to me, this is an excellent measure of “base” Democratic enthusiasm. Based on the numbers so far for VA-08, that “base” Democratic enthusiasm appears to be very high so far! Also, of course, Democratic committees in VA-08 are very strong, so there’s that as well.
- Adding further evidence to that theory, also the same as last week, check out the third-highest number of absentee voting ballots requested/submitted so far (17,316), which is in strongly “blue” VA-11 (Fairfax, Prince William), and which also does not have a competitive House race, as Rep. Gerry Connolly should cruise to an easy, overwhelming victory on November 6. Again, this seems to be a strong sign of high “base” Democratic enthusiasm, plus a very strong Democratic committee.
- VA-01 absentee ballots (12,933) pulled slightly ahead of VA-07 (12,876), which kind of surprises me, given that VA-07 is a hotly contested “purple” district currently held by far-right Republican Dave Brat, and with a strong Democratic challenger in Abigail Spanberger.
- VA-02 is another very competitive, “purple” district, with Rep. Scott “Petitiongate” Taylor up against former Navy Commander Elaine Luria. The number of absentees in VA-02 (10,488) is far lower than in the VA-10 Comstock vs. Wexton slugfest, which is kind of puzzling to me. Note that out of those 10,488 absentees, about 59% are coming from Virginia Beach, which went 52%-47% for Ralph Northam last year. Another 7% are coming from Norfolk City, which went nearly 3:1 for Northam last year; and about 6% coming from Accomack County, which went 54%-46% for Ed Gillespie last year. Just based on these numbers, VA-02 looks close right now.
- Same thing, to a lesser extent, in VA-05, yet another “purple” district with a potentially competitive race, between Democrat Leslie Cockburn and Republican Denver Riggleman. One good sign for Dems in VA-05 is that about 12% of absentees are coming from deep-blue Charlottesville, with another 26% coming from blue Albemarle County, which went 64%-35% for Ralph Northam last year. Combine Cville and Albemarle, and we’re talking about 38% of all the VA-05 absentees coming from strongly “blue” parts of the district.
- VA-04 is strongly Democratic and not at all competitive (Rep. Donald McEachin will cruise to an easy reelection), and those absentee numbers are kind of “meh.” Even more “meh” is VA-03, also strongly Democratic and heavily African American; would feel better if those absentee numbers were higher there.
- Finally, encouraging news: absentee numbers are very low in deep, deep-red VA-09, one of the “Trumpiest” CDs in the country, and not particularly strong in deep-red VA-06 either. Not much indication of a surge in enthusiasm, at least not in terms of absentee ballots, so far in VA-06 or VA-09…
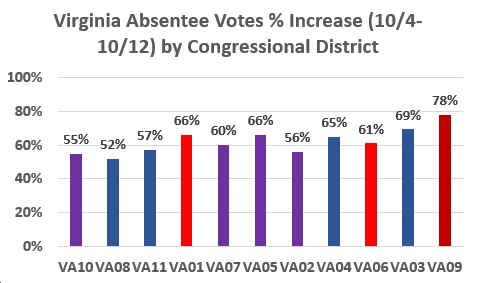
Next, check out the following graph of percent changes in absentee ballots by CD from 10/4 to 10/12. Note that every CD increased by more than 50%, with the biggest increase – albeit from a very low base – in VA09. Overall, nothing’s particularly jumping out at me from this graph…
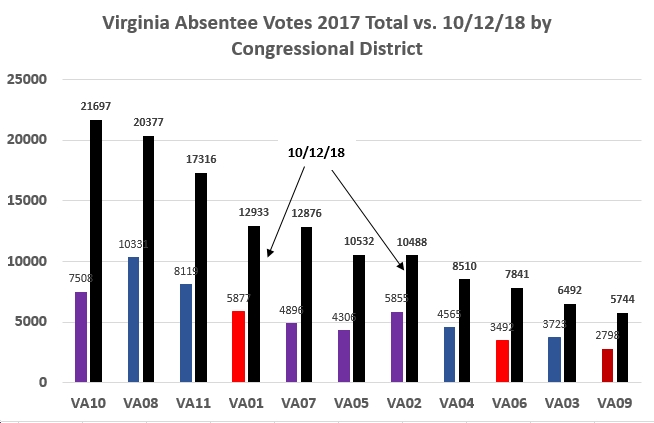
Finally, the next graph shows current absentee ballot numbers (as of 10/12/18) compared to FINAL absentee ballot totals in 2017. As you can see, we’re already far ahead of the pace from 2017, with VA-10 and VA-07 nearly three times their 2017 FINAL numbers. Overall, Virginia has seen more than double the absentee ballots as of 10/12/18 as we saw in 2017 in terms of FINAL numbers. If there’s any correlation between absentee requests and final vote totals, it looks like we’re going to far surpass 2017. But we’ll see…
P.S. Also, check this out, from Fairfax County Dems Chair Dan Lagana.
Holy smokes (again!). 15,766 absentee applications as of today for @FairfaxDems absentee mailing team. A RECORD pace.
TOTAL MAILINGS last year: 13,395
???
Last day to submit an application to vote absentee: 10/30, 5:00pm.#BlueWave #flipthehouse #va10 #bluewave2018
— Dan Lagana (@Dan_Lagana) October 12, 2018