The following numbers are based on votes and spending per Democratic primary candidate through May 30 (which is the latest currently available), so they’re not 100% complete. Still, I feel like they tell some stories, and are not likely to change much when final numbers come in, through June 11.
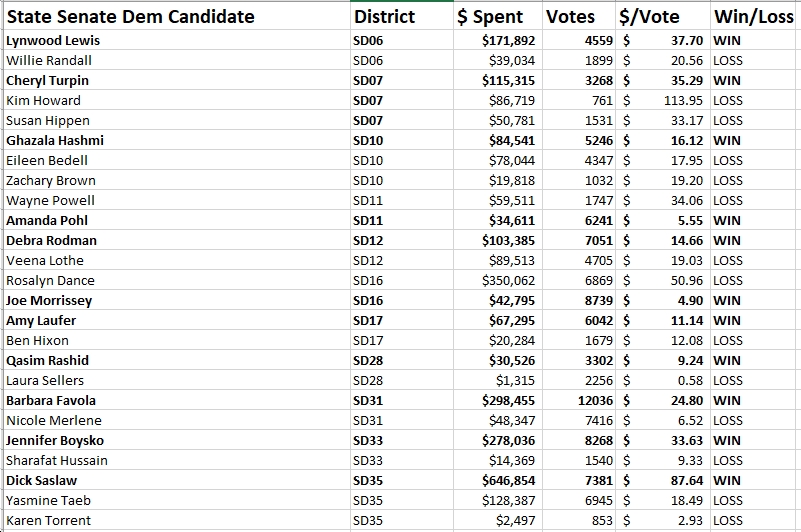
First, check out the State Senate Democratic primary candidates, in order by Senate District (click on image to enlarge). What jumped out at me here was that:
- With only two exceptions (Joe Morrissey’s win over Sen. Rosalyn Dance in SD16; Amanda Pohl’s win over Wayne Powell in SD11), the candidate who spent the most money in their primary won.
- Incumbents won in all of the primaries except for Dance vs. Morrissey.
- By FAR the most money spent was by Dick Saslaw in SD35, who spent
nearly $1.3 million[UPDATE: I misread the VPAP numbers, didn’t notice that for some reason they were displaying back several years, instead of just 2019, so actually Saslaw still spent a lot – $647k – but not nearly $1.3 million. My apologies for the error.] outspending his main opponent, Yasmine Taeb, by about10:15:1 in barely holding his seat. - Also spending a ton of money were Sen. Dance ($350k), who lost; Sen. Barbara Favola in SD31 ($298k – outspent her opponent 6:1), who won; and Sen. Jennifer Boysko in SD33 ($278k – outspent her opponent nearly 20:1), who also won.
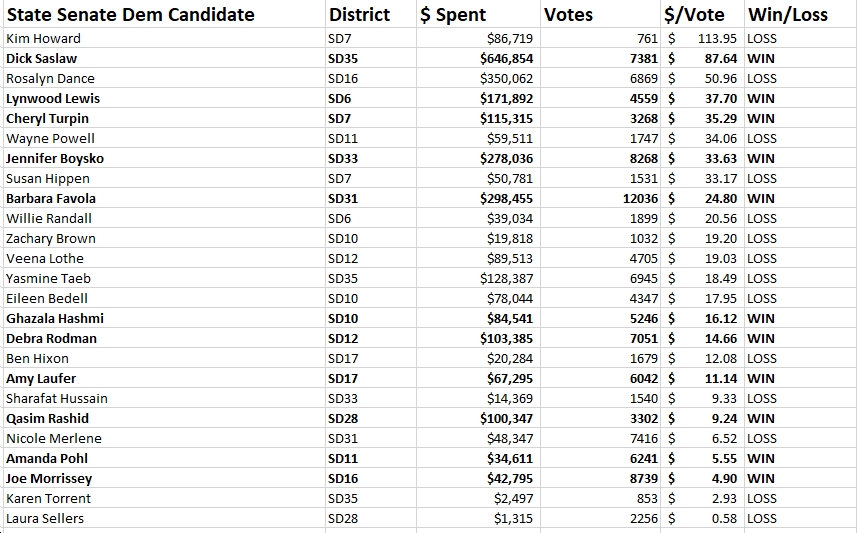
 Now, here are those same numbers, sorted in descending order of money spent per vote received. What jumped out at me here was that:
- Dick Saslaw in SD35 spent
by FAR the mostthe second most ($171$88) per vote, while Laura Sellers in SD28 spent the least, at just $0.58 per vote. - Spending a lot of money per vote didn’t necessarily lead to wins, as only five of the top fourteen candidates in terms of $/vote won their elections, while six of the bottom eleven candidates in terms of $/vote won their elections.
- Kim Howard in SD7 spent $114 per vote, and only got 761 votes, finishing third out of three candidates in that primary.
- Looking at the highest $/vote in each primary doesn’t particularly correlate with winners. In fact, in several districts — Cheryl Turpin in SD7 ($35.29/vote), Ghazala Hashmi in SD10 ($16.12/vote), Amanda Pohl in SD11 ($5.55/vote), Debra Rodman in SD12 ($14.66/vote), Joe Morrissey in SD16 ($4.90/vote), Amy Laufer in SD17 ($11.14/vote) — candidates spending LOWER $/vote actually ended up winning their primaries.
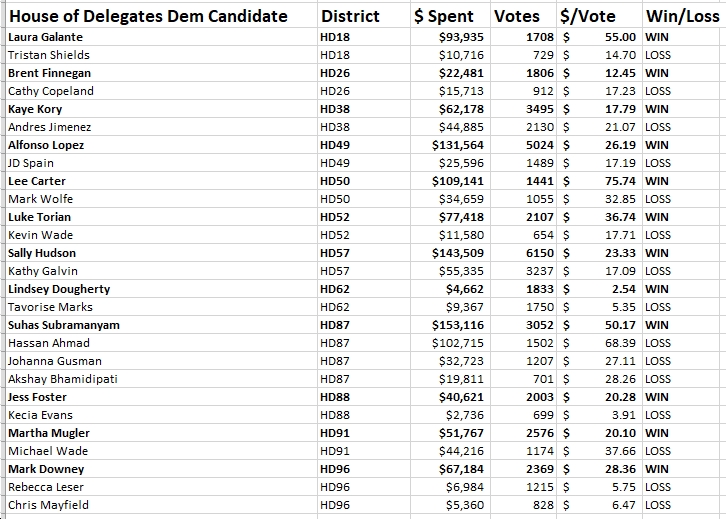
 See below for money spent and vote totals for the House of Delegates Democratic primaries, in ascending order by House district. What jumped out at me here was that:
- In every case except for one (Lindsey Dougherty vs. Tavorise Marks in HD62), the candidate who spent the most money won.
- The biggest spenders were Suhas Subramanyam in HD87 ($153k), Sally Hudson in HD57 ($144k), Del. Alfonso Lopez in HD49 ($132k), and Del. Lee Carter in HD50 ($109k). All of those candidates won their primaries, with the first there winning by huge margins, and Carter by a comfortable margin.
- In terms of outspending their opponents, Jess Foster outspent Kecia Evans by about 15:1 in HD88; Mark Downey outspent Rebecca Leser by more than 9:1 in HD96; Laura Galante outspent Tristan Shields by over 9:1 in HD18; Del. Luke Torian outspent Kevin Wade by 7:1 in HD52; Del. Alfonso Lopez outspent JD Spain by more than 5:1 in HD49.
- In a few cases, winners didn’t outspend their opponents by big margins, but still won big: Suhas Subramanyam ($153k) over Hassan Ahmad ($103k) in HD87, for instance; Brent Finnegan ($22k) over Cathy Copeland ($16k) in HD26; Del. Kaye Kory ($62k) over Andres Jimenez ($45k) in HD38; Martha Mugler ($52k) over Michael Wade ($44k) in HD91.
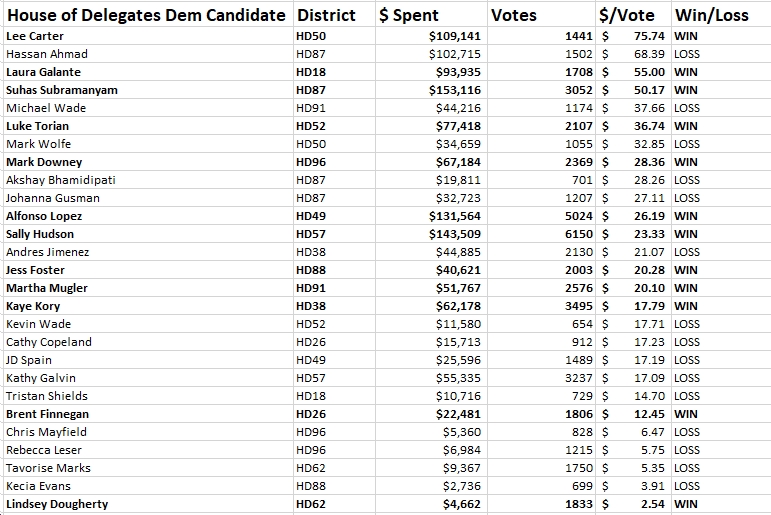
 Now, here are those same numbers, sorted in descending order of money spent per vote received. What jumped out at me here was that:
- Out of the top ten candidates in terms of $/vote, exactly half won and half lost. Out of the bottom eleven in terms of $/vote, only two won and nine lost.
- The spread on these $/vote ratios ($75.74/vote down to $2.54/vote) was far less than for the State Senate Democratic primary candidates ($171.32/vote down to $0.58/vote).
- The candidate spending the least amount of money per vote – Lindsey Dougherty in HD62 – ended up winning, as did the candidate spending the most money per vote – Del. Lee Carter in HD50.
- The losing candidate spending the most per vote was Hassan Ahmad in HD87 ($68.59/vote), followed by Michael Wade in HD91 ($37.66/vote) and Mark Wolfe in HD50 ($32.85/vote).
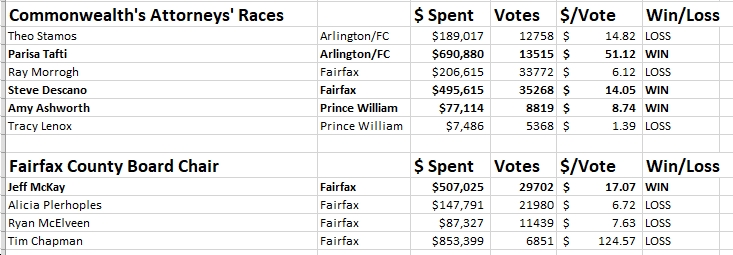
 I looked at a few key local races – Commonwealth’s Attorney in Fairfax and Arlington/Falls Church, plus the Fairfax County Board Chair race, and found some interesting results.
- In the Commonwealth’s Attorneys races, the candidate spending the most money (Steve Descano – $496k; Parisa Tafti – $691k; Amy Ashworth – $77k) won.
- Amy Ashworth outspent her opponent, Tracy Lenox, by a nearly 11:1 margin. Parisa Tafti outspent her opponent, Theo Stamos, by a nearly 4:1 margin. And Steve Descano outspent his opponent, Ray Morrogh, by more than a 2:1 margin.
- In terms of $/vote, Tafti topped out at $51.12/vote, followed by Theo Stamos at $14.82/vote, Steve Descano at $14.05/vote, Amy Ashworth at $8.74/vote, Ray Morrogh at $6.12/vote and Tracy Lenox at $1.39/vote.
- Finally, on the Fairfax County Board Chair race, by far and away the most money spent was by Tim Chapman ($853k), which translated to a whopping $125/vote. In contrast, the winner – Jeff McKay – spent $507k, which translated to $17/vote. Alicia Plerhoples spent just $6.72/vote in finishing a strong second to McKay. So again, money certainly matters, but it’s definitely not everything…
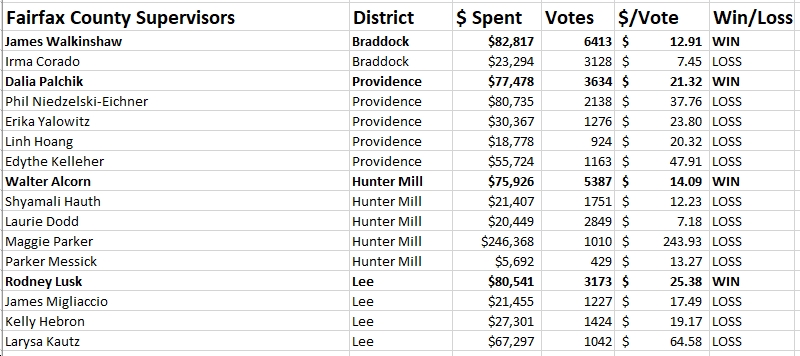
UPDATE 6/19: See below for numbers for Fairfax County Board of Supervisors races
- In the Fairfax County Board of Supervisors magisterial district Democratic primaries, spending the most money didn’t necessarily translate into victory, as demonstrated by Hunter Mill District’s Maggie Parker, who spent the most ($246k), yet finished fourth out of five contenders; and Providence District’s Dalia Palchik, who was narrowly outspent by Phil Niedzelski-Eichner, but won easily.
- Overall, by far and away the most money spent was by big-developer-funded Maggie Parker – and fortunately, all that money didn’t buy developers and Republicans a win in Hunter Mill District. Far from it, in fact.
- Rodney Lusk spent the most ($81k) in Lee District…and won easily. James Walkinshaw spent the most ($83k) in Braddock District…and also won easily.
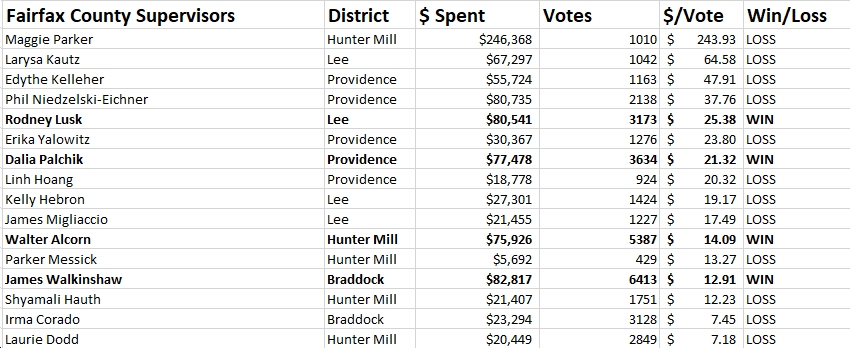
- In terms of money spent per vote, Maggie Parker was by far in the lead, at a whopping $243.93 (!) per vote. Next was Larysa Kautz, at $64.58 per vote; and Edythe Kelleher, at $47.91 per vote. Kautz finished fourth out of four candidates in her race and Kelleher finished fourth out of five candidates in hers.
- The lowest amount of money spent per vote was Laurie Dodd in Hunter Mill, who finished second despite only spending $7.18 per vote. Next lowest in terms of money spent per vote was Irma Corado in Braddock district, at $7.45 per vote.
- The lowest amount of money spent per vote by a winning candidate was by Braddock District’s James Walkinshaw, at $12.91 per vote. Hunter Mill’s Walter Alcorn was next lowest, at $14.09 per vote; followed by Providence’s Dalia Palchik, at $21.32 per vote; and Lee District’s Rodney Lusk, at $25.38 per vote.
- Five of the top six candidates with the highest per-vote spending actually lost their elections, while two of the bottom six won. So…not seeing any positive correlation here.



![Video: Former Eastern District of VA Federal Prosecutor Gene Rossi Asks, “Is Donald Trump going to be the lead counsel in that prosecution [of Jim Comey] and do the opening, closing and rebuttal? I pray that he does!”](https://bluevirginia.us/wp-content/uploads/2025/09/rossiedva-238x178.jpg)



![[UPDATED 1/29/26] Audio: Sen. Tim Kaine Talks to Blue Virginia About His “Five-Point Plan” to Fight Trump’s Orban-Like Assault on US Democracy; Civil Disobedience a la MLK Jr.; Trump’s Bogus “Energy Emergency”; the Crucial Importance of the 2025 VA Elections; etc.](https://bluevirginia.us/wp-content/uploads/2025/02/kaineinterview2-100x75.jpg)

