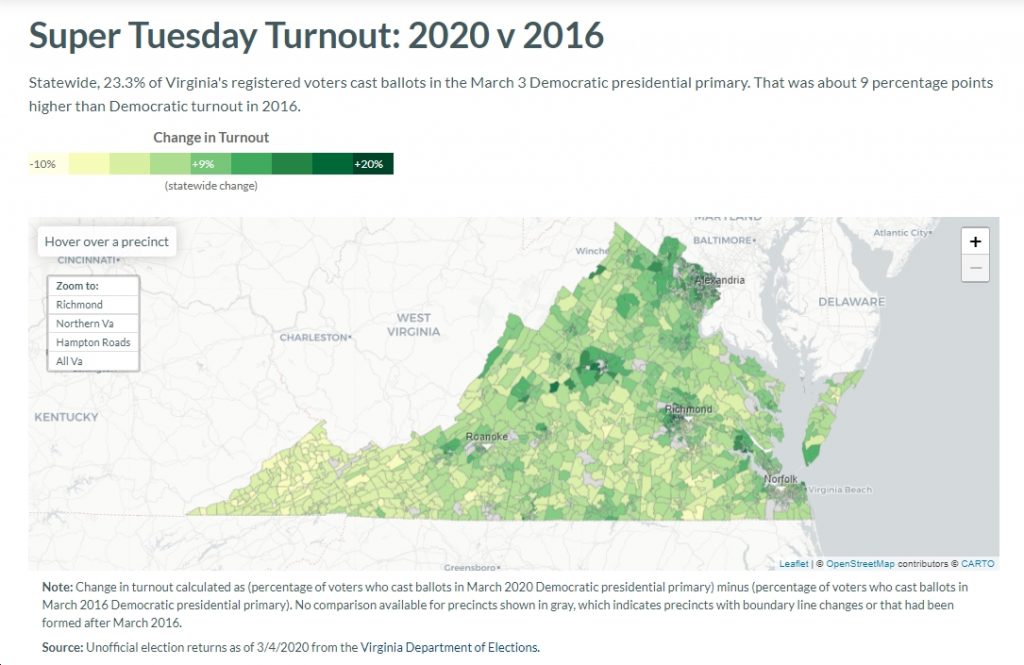
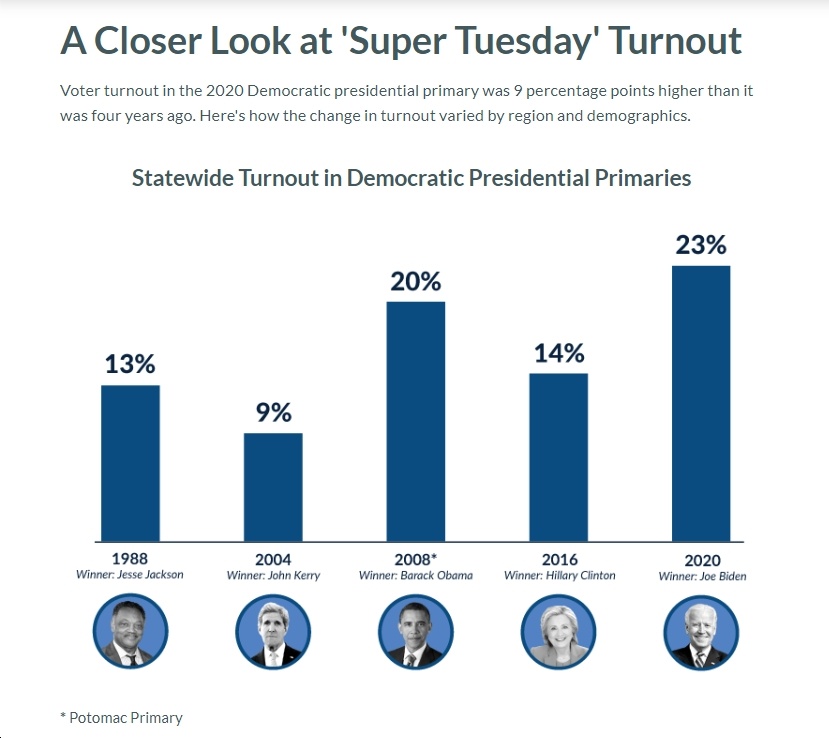
See below for some interesting graphics and maps, courtesy of VPAP regarding turnout this “Super Tuesday” in Virginia compared to previous Democratic presidential primaries in Virginia.
First, this graphic shows that voter turnout in 2020 was 9 percentage points higher than four years ago (Hillary Clinton was the winner), 3 points higher than in 2008 (when Barack Obama won), 14 points higher than in 2004 (John Kerry won) and 10 points higher than in 1988 (Jesse Jackson won). Are Democratic voters motivated to vote Trump out of the White House in November? It sure looks like it, based on the turnout numbers we saw in Virginia and other states on Super Tuesday!
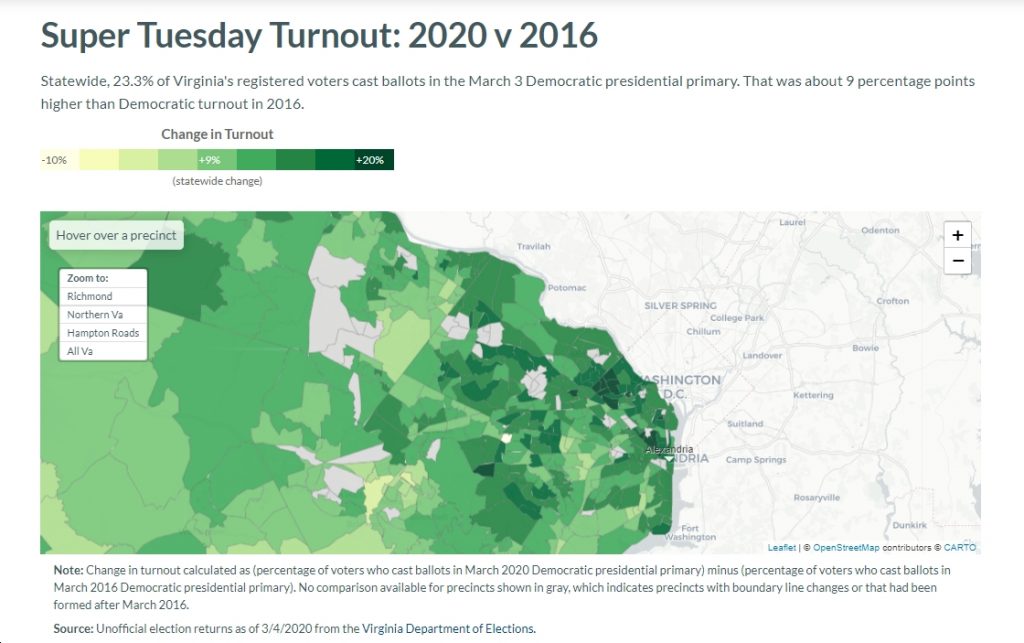
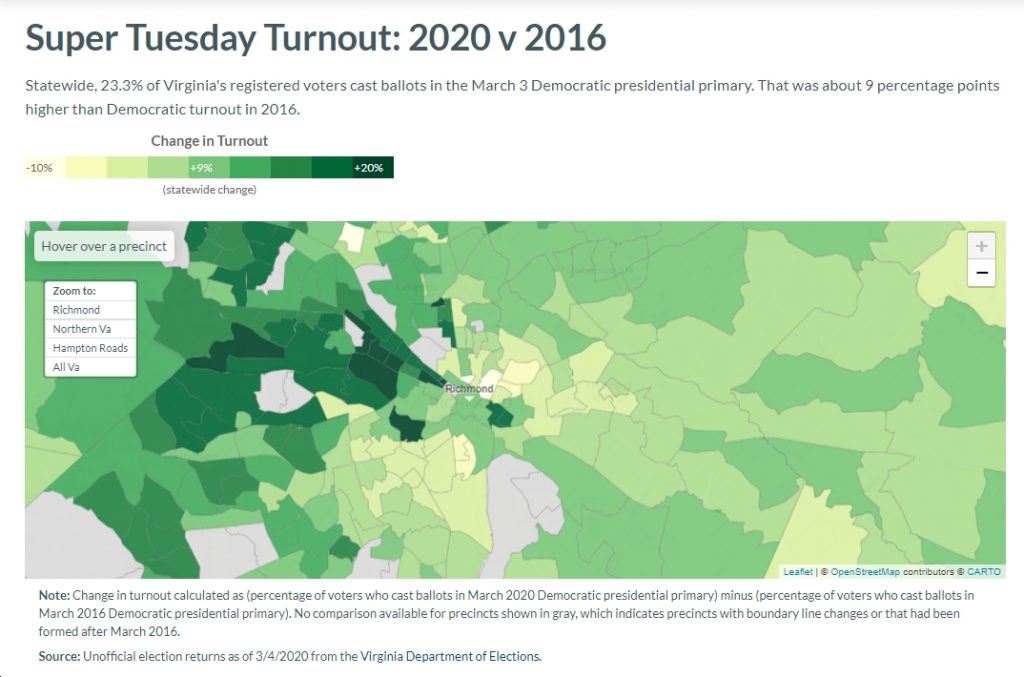
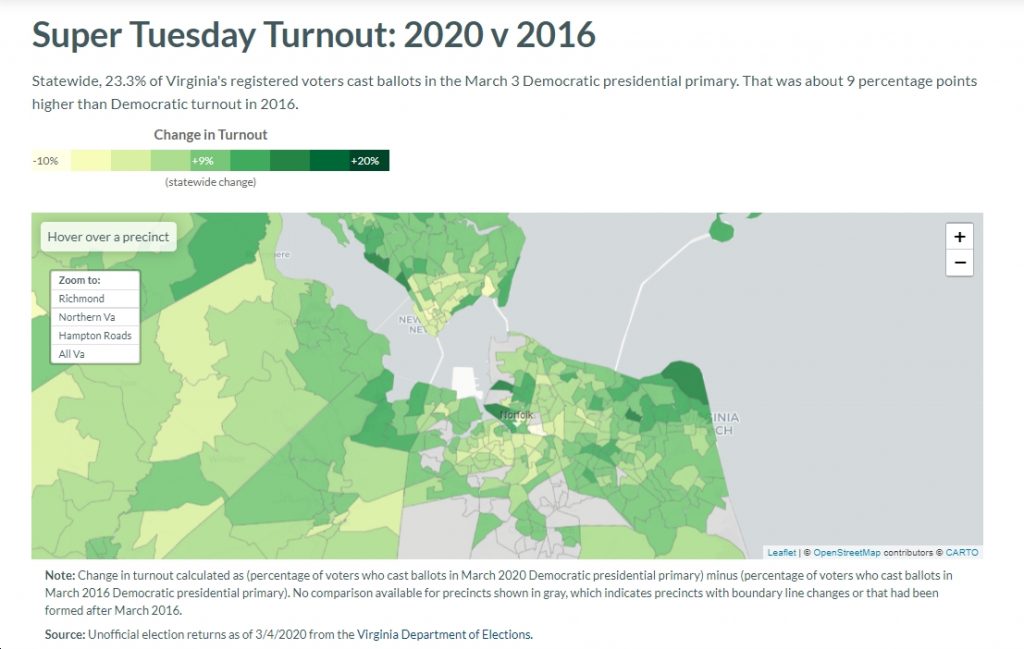
Now, here are several maps showing Super Tuesday turnout here in Virginia in 2020 vs. 2016. As noted above, “23.3% of Virginia’s registered voters cast ballots in the March 3 Democratic presidential primary,” which “was about 9 percentage points higher than Democratic turnout in 2016.” A few more details jump out at me:
- Turnout really jumped in Democratic strongholds – the Richmond area, Northern Virginia, Albemarle County, and Hampton Roads. Turnout was flat or even down in southwestern Virginia and large swaths of “Southside” and the Shenandoah regions.
- A few examples of precincts in Northern Virginia where turnout really jumped from 2016 include: Rock Spring in north Arlington jumped 20.6% from 2016; same thing with several other precincts in that area (e.g., Nottingham +20.1%, Yorktown +19.2%, Lexington +18.2%…); also +18.5% in Clarendon. In south Arlington, Fairlington precinct turnout jumped 20.4%. And in neighboring Alexandria, turnout jumped 20.7% at the Maury School, 19.5% at Blessed Sacrament Church, 19.5% at George Mason School. In Fairfax County, turnout increased 18.6% at Shreve precinct in the eastern part of the county; also 18.3% at Fairfax Station in the western part of the county.
- Note that Joe Biden romped in all those Arlington (e.g., he got over 60% in Yorktown), Alexandria (e.g., he got 57% at the Maury School precinct) and Fairfax County precincts (e.g., he got 56% at Fairfax Station) that I mentioned.
- In the Richmond area, turnout spiked 20.9% at Richmond City’s Precinct 207 (which Bernie Sanders narrowly won); 20.6% at Precinct 106 (which Joe Biden won by a large margin); 19.5% at Precinct 105 (which Joe Biden also win by a big margin); 19.4% at Precinct 104 (ditto); 18.9% at Precinct 402 (ditto); etc. Turnout also increased sharply at Henrico County’s Mooreland precinct (+19.6%), which Joe Biden won by a wide margin; and Tuckahoe precinct (+17.4%), which Biden also win by a wide margin.
- In the Hampton Roads area, turnout was up 14.9% in Virginia Beach’s Kingston precinct, which Biden won by a wide margin; 14.7% in Newport News’ Riverside precinct, which Biden also won by a wide margin; 12.1% in Virginia Beach’s Cape Henry precinct (ditto); 13.7% in Norfolk’s Larchmont Library precinct (ditto); 12.9% in Norfolk’s Taylor Elementary School precinct (where Biden narrowly defeated Sanders); etc.
- Turnout was way actually down slightly in several precincts in Wise County, Dickenson County, Russell County, Buchanan County, but mostly turnout was flat or slightly higher in much of southwestern Virginia and Southside.
- What else jumps out at you from these graphics and maps?
