| Getting your Trinity Audio player ready... |
See below for some interesting info about the 2021 Virginia General Assembly and legislators’ “batting averages,” courtesy of VPAP. Keep in mind as you look at these that – as I wrote last March – there are many caveats.
- As Cindy pointed out in March 2019, after VPAP came out with its 2019 legislative “batting averages,” these numbers can be *highly* misleading if you look at them the wrong way. Or, as in the case of VPAP, they can be misleading if you fail to present the numbers with explanation, important context, etc. as VPAP indeed fails to do. [UPDATE: VPAP is now out with its 2020 “batting averages,” yet again not presented with explanation or context, but simply as a “success rate” – not good]
- For starters, as Cindy explained, “There are many, many ways that a legislator might end up with a low ‘batting average’ on the VPAP scorecard. The legislator might, in fact, put in lots of ill-conceived bills–ideas that haven’t really been thought through very well, poorly designed plays.”
- Or, “a legislator might also end up with a low score by putting in lots of controversial or partisan bills.”
- “On the flip side, a sure way to get a high score is to put in a lot of relatively sleepy little bills–clean up some badly-worded or vague section of the code, solve some minor local problem, be the patron of one of the many, many bills that are voted through unanimously – ‘in the uncontested block.’”
- “Lastly, a legislator may get a high score for having a good sense of what can or cannot pass, for working hard with stakeholders and other legislators before and during the process to tweak the language so that it will have as little opposition as possible, for being willing to amend on the fly as needed. Think of this as playing good, smart, fundamentally sound baseball.”
- “But just like a win-loss record is a poor measure of how your pitcher did, and how ‘advanced sabermetrics’ are far more revealing, this VPAP ‘batting average’ is a poor metric for how our legislators did.”
- Another important issue is that there are numerous cases where bills are listed in the Legislative Information System (LIS) as not having “passed” – thus, implying failure – when, in reality, the bills were “incorporated” into other bills, including ones that ended up passing! Which means that what LIS implies is a “failure” could actually be a success. For instance, House Majority Whip Alfonso Lopez had 13 of his bills incorporated into other peoples’ bills that passed. But that isn’t easy to find out, unless you look at the bills one at a time or talk to each legislator. Which would take many, many, many hours…no, thanks.
- I’d also note that some bills are massive, complex, technical, etc, etc. – the Virginia Clean Economy Act, for instance – and can suck up huge amounts of a legislator’s time. On the other hand, these types of bills might also be extremely important, even transformative, pieces of legislation, that are well worth spending that time. But…in spending all that time on a super-important, massive, highly complex, tremendously consequential bill, you might not be focused on churning out smaller, less “significant” bills. Should you be “dinged” for that? Not really. But a one-size-fits-all batting average might do just that. So…definitely keep that in mind when looking at the following stats.
- Also worth looking at, along with the % of patroned bills passed, is how many bills each legislator put in, and how many total bills passed. Thus, clearly having a 100% batting average is not nearly the same thing if you patroned one or two bills that passed versus, let’s say, 40-50 bills, of which perhaps half or two-thirds passed. And again, one really needs to look at how complex, “significant,” etc. each bill is, as well as how much time/effort was required of the patron to get it passed, how much help they had in doing so, etc.
- Finally, it’s important to keep in mind that different members of the General Assembly have different roles. Thus, someone in leadership might spend a big chunk of their time…well, leading! As opposed, that is, to worrying as much about their own bills. Or maybe they try to do both. But regardless, the point is, again we’re somewhat comparing apples/oranges/bananas here.
- With all those caveats, there’s an argument that, perhaps, “batting averages” and statistics like the following – or scorecards like VAPLAN‘s, for that matter – aren’t even worth presenting. Or maybe they’re worse than nothing, as they could be misleading? I’d argue that, yes, that’s all true, if you just take the “batting averages” alone, and don’t do some serious “advanced sabermetrics,” as Cindy notes. In short, I’d use the following numbers to *start* a conversation, most definitely not to *end* it. With that…here are the numbers, with a few things that jumped out at me (above each graphic)…
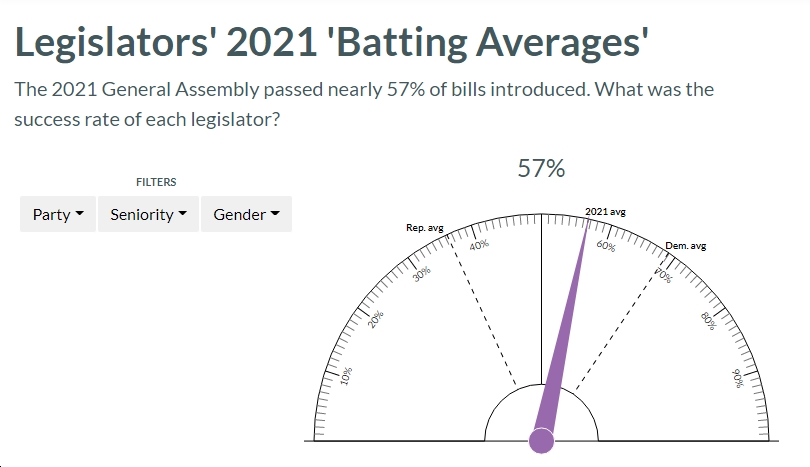
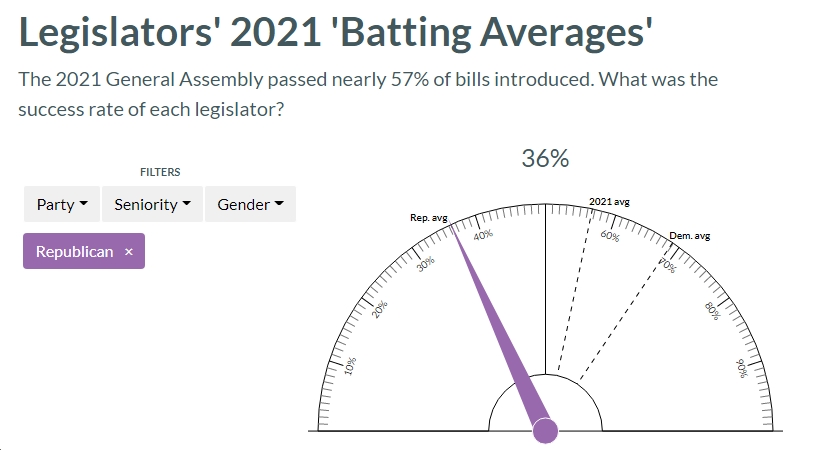
Overall, in the 2021 General Assembly, 57% of introduced bills ended up passing.
Not surprisingly, given that they’re in the minority and have lurched to the far right, Republicans’ “batting average” is far lower than the average, with just 36% of Republican bills introduced eventually passing.
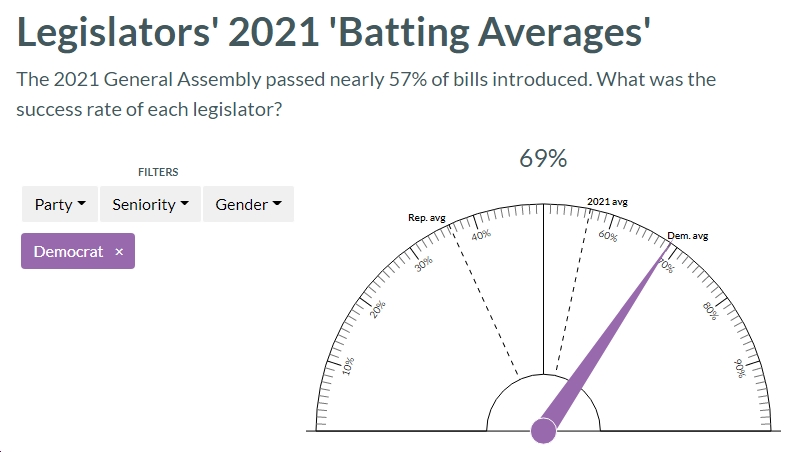
Democrats, in the majority and much more in the mainstream of public opinion on issue after issue, ended up with 69% of the bills they introduced getting passed.
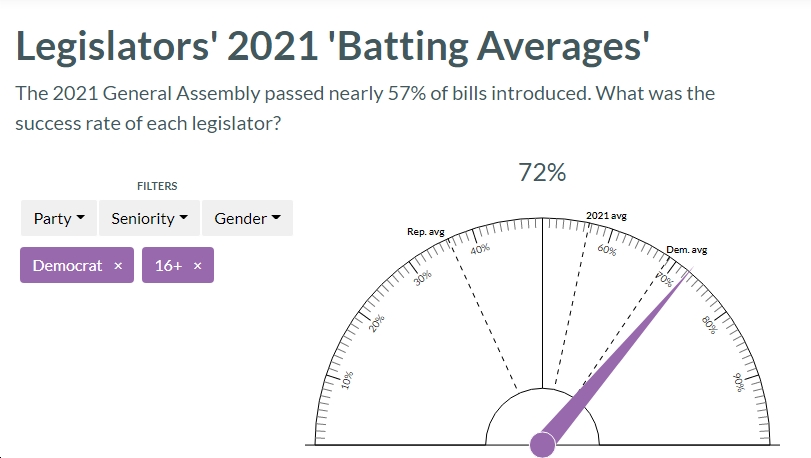
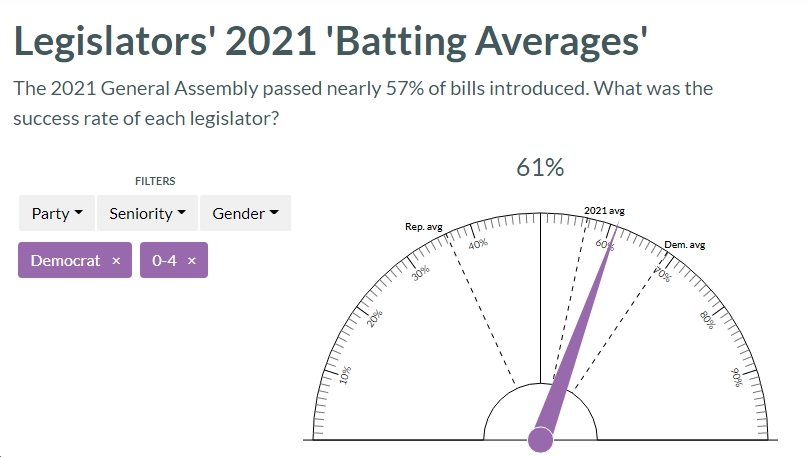
Democrats with 16+ years of experience saw 72% of their introduced bills end up getting passed. Those with 0-4 years of experience saw 61% of their introduced bills end up getting passed…still good, but lower than those with 16+ years of experience.
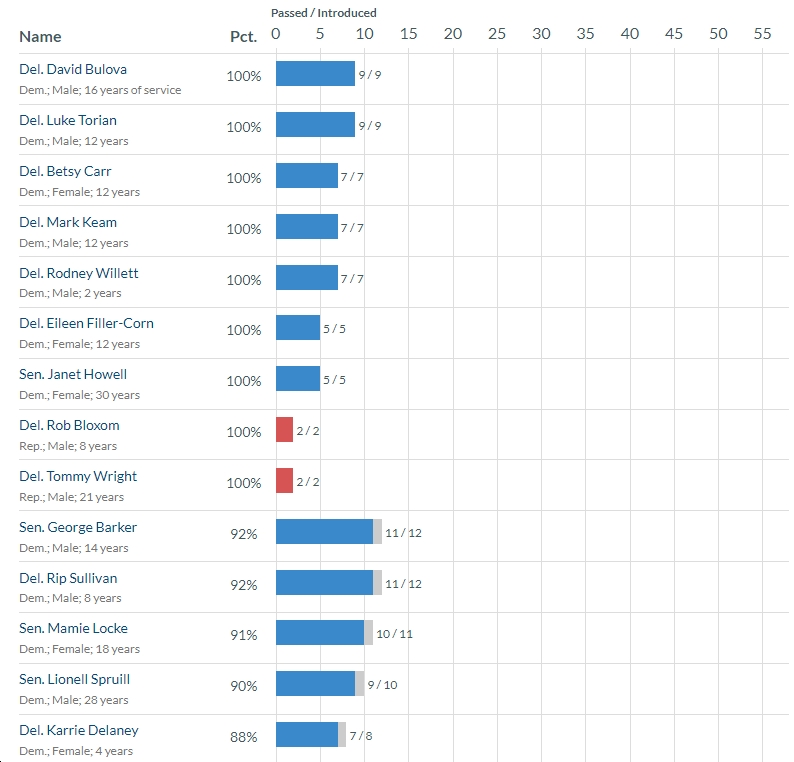
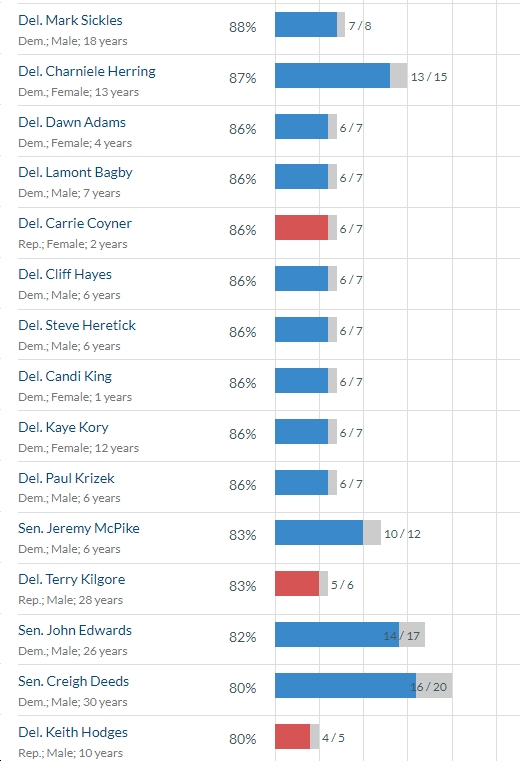
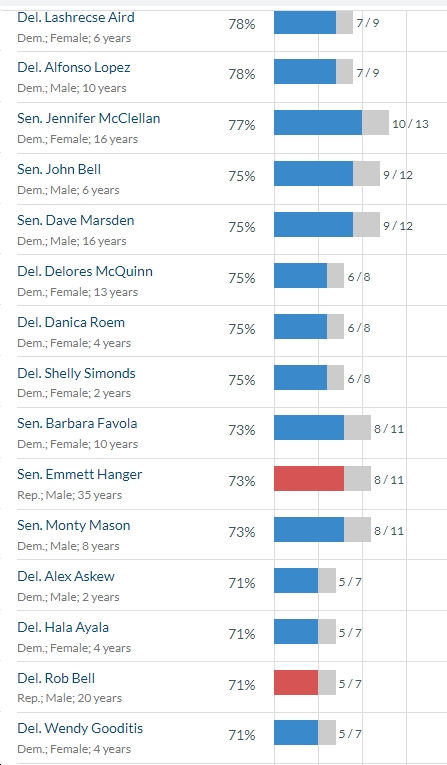
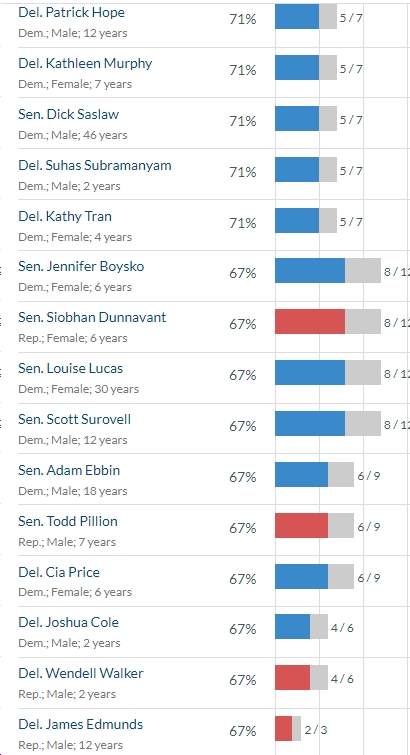
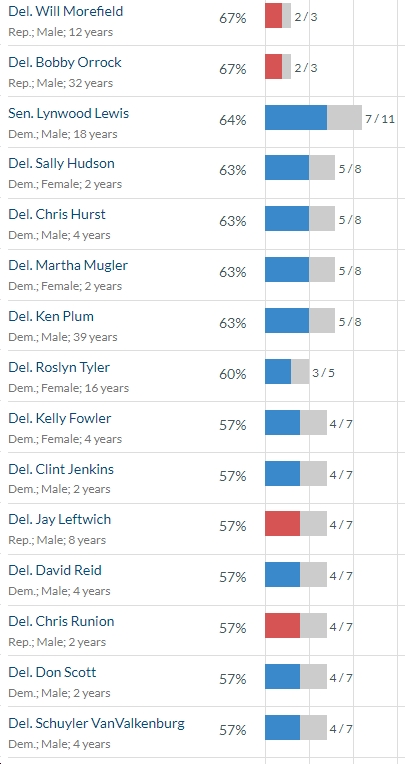
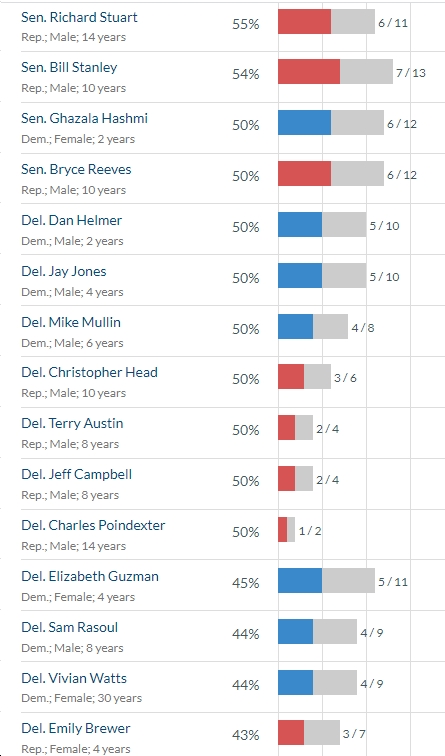
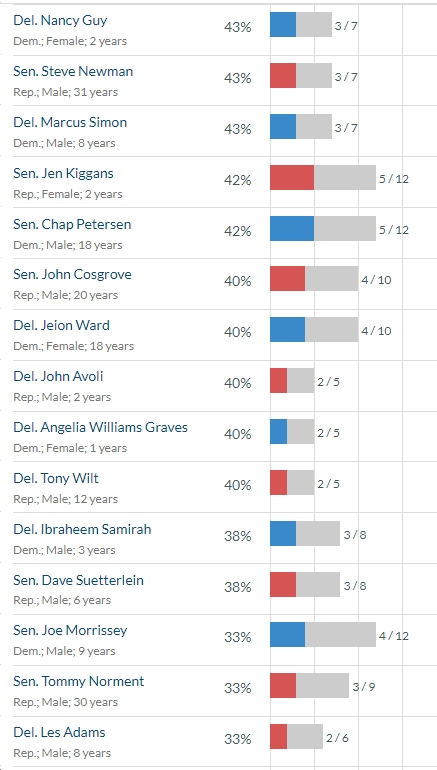
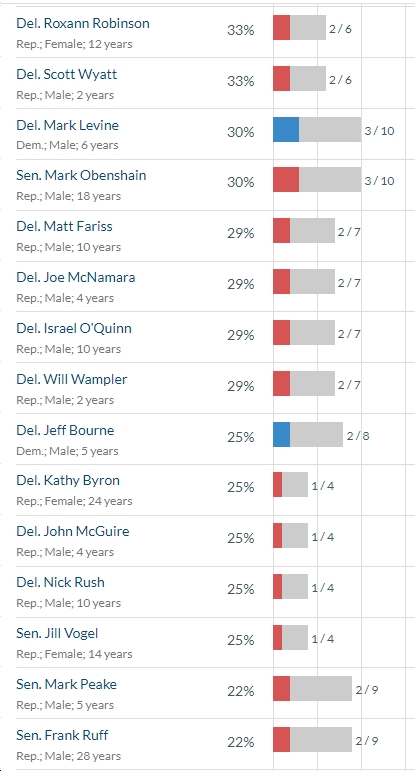
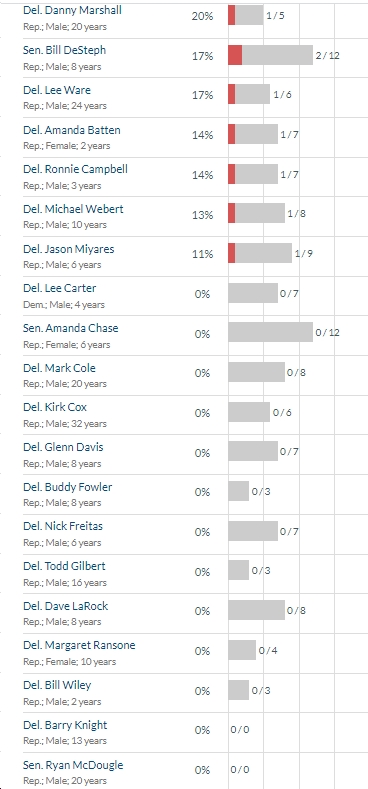
Here are the rankings, from 100% down to 0%, for all Virginia legislators. As you can see, the highest batting averages skew heavily “blue” (Delegates David Bulova, Luke Torian, Betsy Carr, Mark Keam, Rodney Willett, Eileen Filler-Corn plus Sen. Janet Howell all at 100%; Sen. George Barker, Sen. Mamie Locke, Sen., Lionell Spruill and Del. Rip Sullivan all at 90% or higher) while the lowest batting averages skew heavily “red.” For instance, there are only five Republicans with batting averages 80% or higher, compared to 24 Democrats at 80% or higher. At the other end of the spectrum, only three Democrats (Del. Lee Carter, Del. Jeff Bourne, Del. Mark Levine) were at 30% or below, while 12 Republicans (Sen. Amanda Chase, Del. Mark Cole, Del. Kirk Cox, Del. Glenn Davis, Del. Buddy Fowler, Del. Nick Freitas, Del. Todd Gilbert, Del. Dave LaRock, Del. Margaret Ransone, Del. Bill Wiley, Del. Barry Knight, Sen. Ryan McDougle ) were at zero batting averages and another 18 Republicans (Sen. Mark Obenshain, Del. Mark Fariss, Del. Joe McNamara, Del. Israel O’Quinn, Del. Will Wampler, Del. Kathy Byron, Del. John McGuire, Del. Nick Rush, Sen. Jill Vogel, Sen. Mark Peake, Sen. Frank Ruff, Del. Danny Marshall, Sen. Bill DeSteph, Del. Lee Ware, Del. Amanda Batten, Del. Ronnie Campbell, Del. Michael Webert, Del. Jason Miyares) at 30% or below.