Courtesy of VPAP, it’s “batting average” time for the 2024 Virginia General Assembly. See below for screenshots and highlights. First, though, see here for the usual caveats, including:
- These numbers can be *highly* misleading if you look at them the wrong way, or if you fail to present the numbers with explanation, important context, etc.
- Also, as Cindy Cunningham explained back in 2019, “There are many, many ways that a legislator might end up with a low ‘batting average’ on the VPAP scorecard. The legislator might, in fact, put in lots of ill-conceived bills–ideas that haven’t really been thought through very well, poorly designed plays.”
- Or, “a legislator might also end up with a low score by putting in lots of controversial or partisan bills.”
- “On the flip side, a sure way to get a high score is to put in a lot of relatively sleepy little bills–clean up some badly-worded or vague section of the code, solve some minor local problem, be the patron of one of the many, many bills that are voted through unanimously – ‘in the uncontested block.’”
- “…a legislator may get a high score for having a good sense of what can or cannot pass, for working hard with stakeholders and other legislators before and during the process to tweak the language so that it will have as little opposition as possible, for being willing to amend on the fly as needed. Think of this as playing good, smart, fundamentally sound baseball.”
- “But just like a win-loss record is a poor measure of how your pitcher did, and how ‘advanced sabermetrics’ are far more revealing, this VPAP ‘batting average’ is a poor metric for how our legislators did.”
- Also worth looking at, along with the % of patroned bills passed, is how many bills each legislator put in, and how many total bills passed. Thus, clearly having a 100% batting average is not nearly the same thing if you patroned one or two bills that passed versus, let’s say, 40-50 bills, of which perhaps half or two-thirds passed. And again, one really needs to look at how complex, “significant,” etc. each bill is, as well as how much time/effort was required of the patron to get it passed, how much help they had in doing so, etc.
- This year, we saw House Democrats kill a LOT of Republicans’ bills, many of which were far right, extreme, crazy, etc. And Senate Democrats killed almost all right-wingnut, anti-environment, etc. bills by Republicans. So keep that in mind as you look at the “batting averages.”
- Finally, it’s important to keep in mind that different members of the General Assembly have different roles. Thus, someone in leadership might spend a big chunk of their time…well, leading! As opposed, that is, to worrying as much about their own bills. Or maybe they try to do both. But regardless, the point is, again we’re somewhat comparing apples/oranges/bananas here.
- With all those caveats, there’s an argument that, perhaps, “batting averages” and statistics like the following aren’t even worth presenting. Or maybe they’re worse than nothing, as they could be misleading? I’d argue that, yes, that’s all true, if you just take the “batting averages” alone, and don’t do some serious “advanced sabermetrics,” as Cindy notes. In short, I’d use the following numbers to *start* a conversation, most definitely not to *end* it. With that…here are the numbers, with a few things that jumped out at me (above each graphic)…
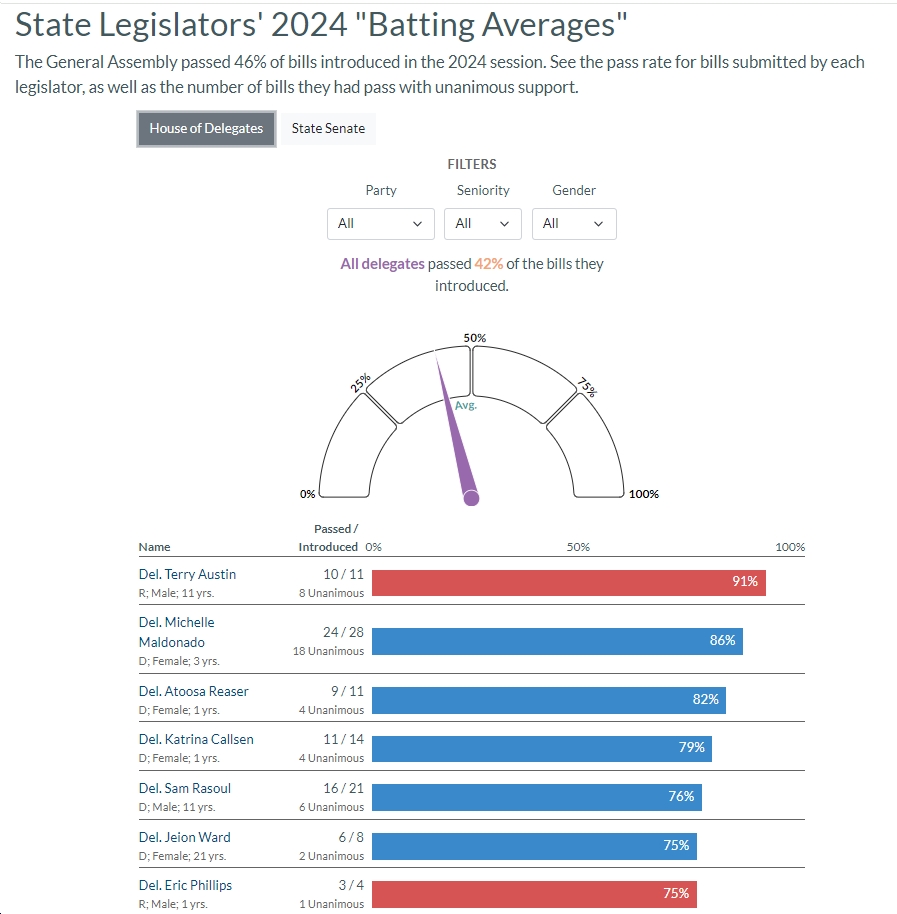
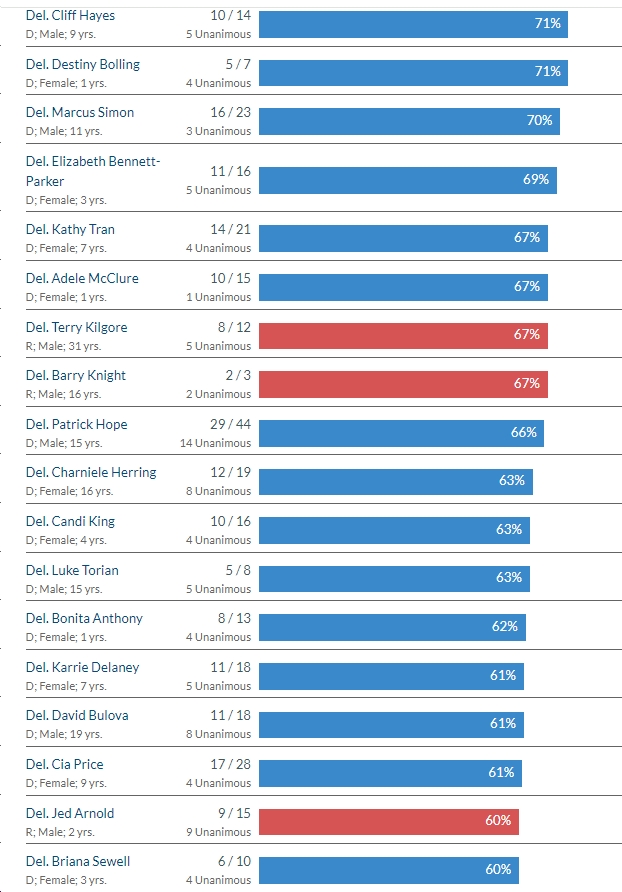
Overall, in the 2024 General Assembly, 46% of introduced bills ended up passing – up slightly from 43% last year and 40% in 2022, but down from 57% in 2021. By party, House Republicans passed 26% of their introduced bills, while House Democrats passed 53%. Senate Republicans passed 40% of their introduced bills – compared to 63% for Senate Democrats. Male delegates passed 37% of their introduced bills vs. 51% for female delegates. And male Senators passed 53% of their introduced bills vs. 55% for female Senators. Delegates with just 0-4 years of seniority passed just 37% of their introduced bills while those with 11-15 years of seniority passed 53% of their introduced bills. You can slice and dice these numbers any way you’d like, so play around with it on VPAP if you’re so inclined.
There’s tons of information here, but a few things that jumped out at me were (in no particular order):
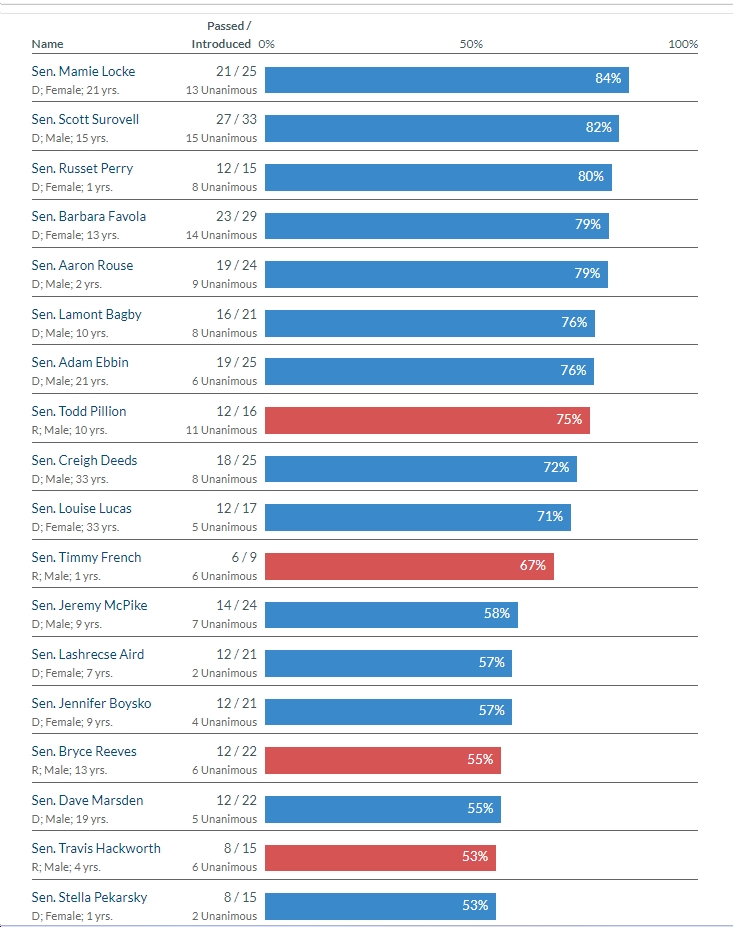
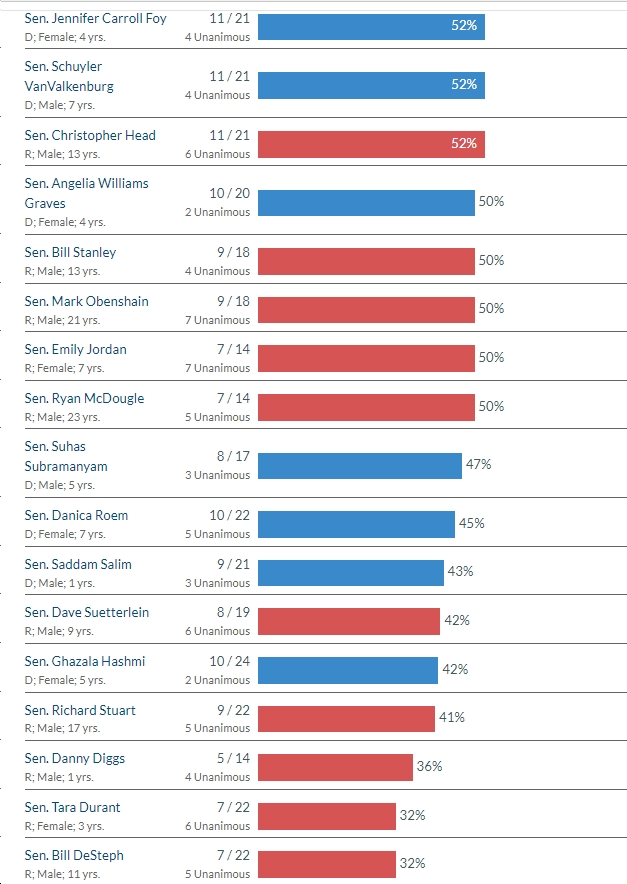
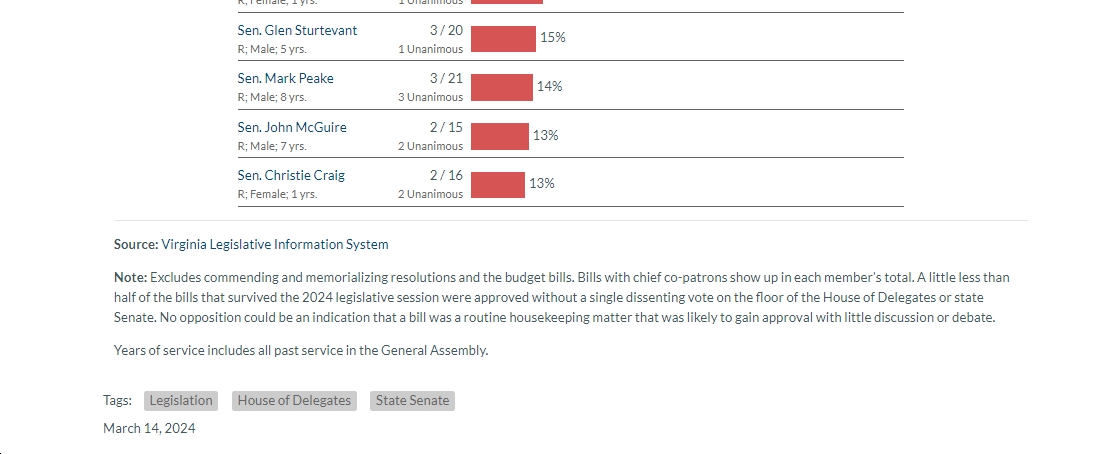
- Not surprisingly, some of the most extreme/MAGA and non-serious State Senators – insurrectionist John McGuire (2/15), Glen Sturtevant (who’s morphed from being a relatively “moderate” Republican to a male version of Amanda Chase – 3/20), hard-right Tammy Mulchi (1/6) and Mark Peake (3/21), etc. – had the lowest “batting averages” – all under 20%. Pitiful. By the way, John McGuire went 1/12 last year in the House of Delegates, making him a godawful 3/27 combined over the past two years. Great, huh? Definitely worth a promotion to the US House? LOL
- On the other hand, the highest “batting averages” in the State Senate were almost all Democrats – Mamie Locke (21/25, or 84%); Scott Surovell (27/33, or 82%); Russet Perry (12/15, or 80%); Barbara Favola (23/29, or 79%); Aaron Rouse (19/24, or 79%); Lamont Bagby (16/21, or 76%); Adam Ebbin (19/25, or 76%). Nice job!
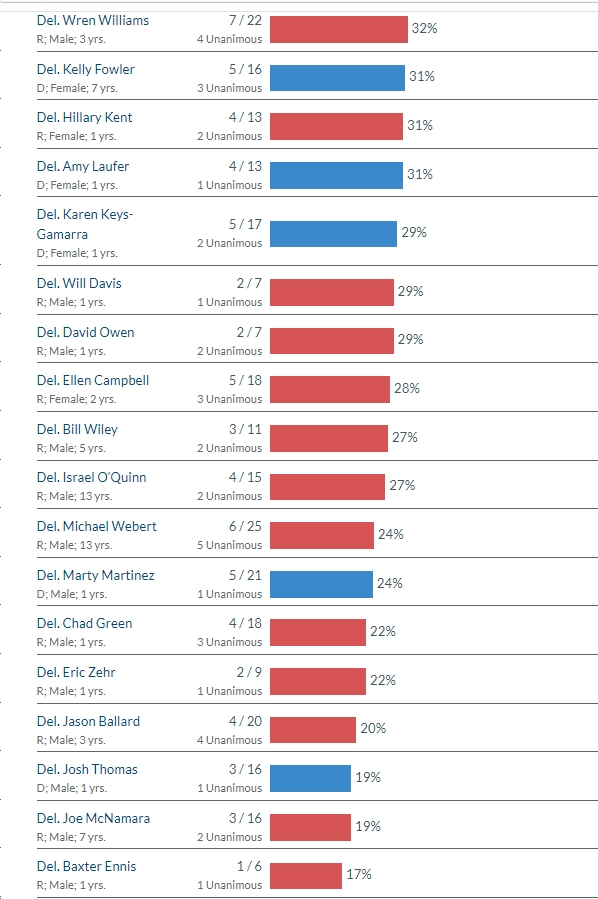
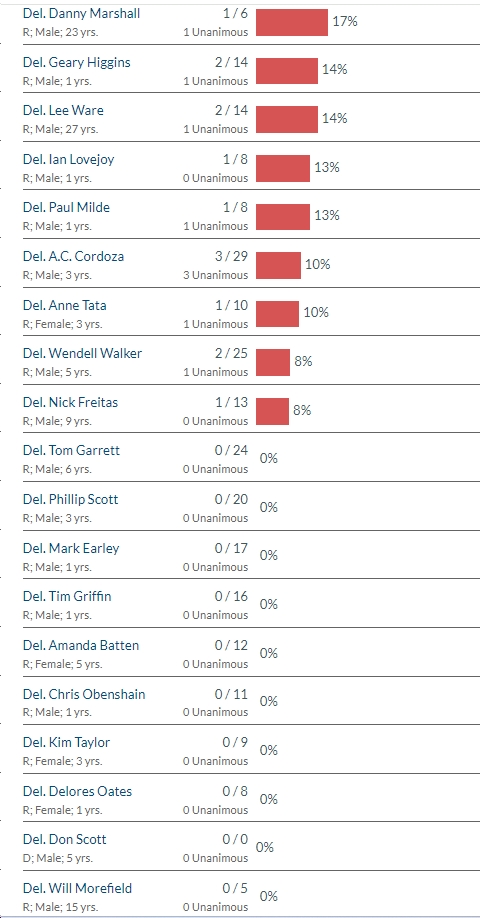
- In the House of Delegates, the worst “batting averages” were pretty much all far-right/MAGA Republicans, with some of the worst being Tom Garrett (0/24); Phillip Scott (0/20); Mark Earley (0/17); Tim Griffin (0/16); Nick Freitas (1/13); Wendell Walker (2/25); AC Cordoza (3/29); etc. Note that Freitas went 0/16 last year, making him 1/29 over the past two years – pretty close to completely worthless as a legislator, whether Republicans or Democrats are in charge – but he sure does like bloviating on the House floor!
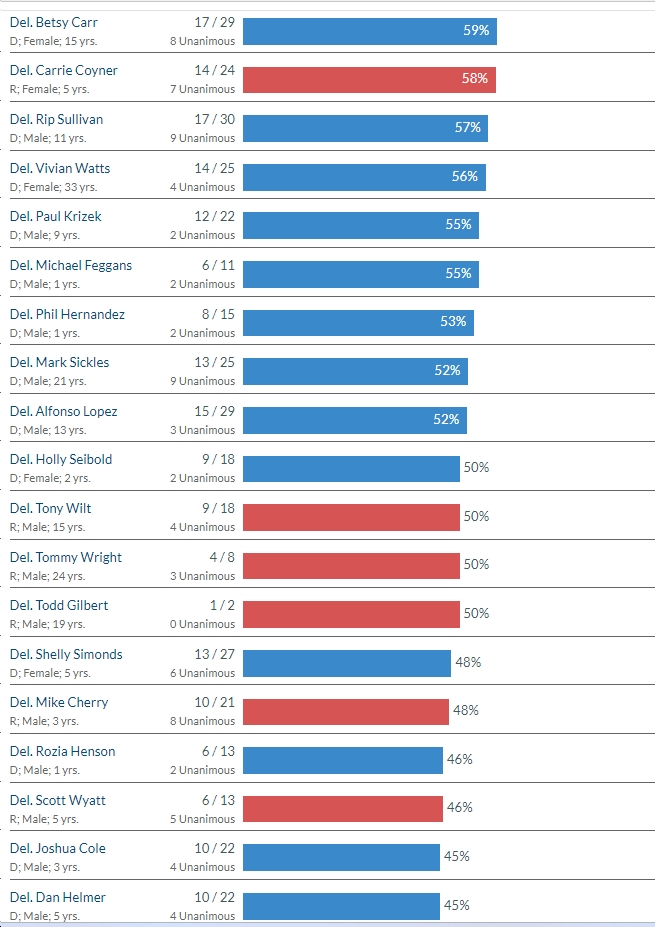
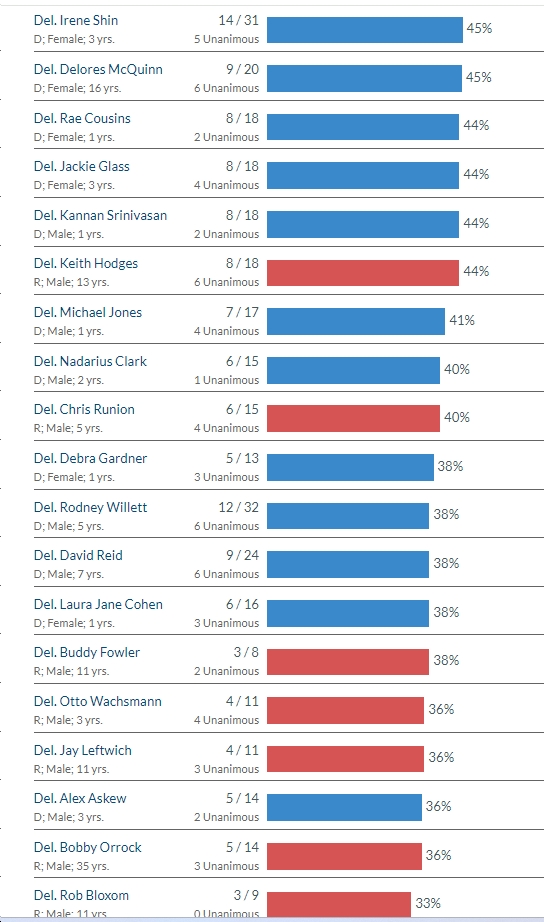
- Overwhelmingly, the highest “batting averages” in the House of Delegates were Democrats – Michelle Maldonado (24/28, or 86%); Atoosa Reaser (9/11, or 82%); Katrina Callsen (11/14, or 79%); Sam Rasoul (16/21, or 76%); Jeion Ward (6/8, or 75%); etc. The lowest-scoring Dems were mostly first-year delegates (e.g., Josh Thomas went 3/16, Mary Martinez went 5/21, Karen Keys-Gamarra went 5/17, Amy Laufer went 4/13), although other first-year delegates like Atoosa Reaser (9/11) and Katrina Callsen (11/14) – as noted above – did VERY well. So…not sure what the low scores were all about in those cases.
So what jumps out for you in these statistics?