
VPAP is out with its annual legislators’ “batting averages,” as you can see in the following screenshots. But first, see here for all the usual caveats:
- These numbers can be *highly* misleading if you look at them the wrong way, or if you fail to present the numbers with explanation, important context, etc.
- Also, as Cindy Cunningham explained back in 2019, “There are many, many ways that a legislator might end up with a low ‘batting average’ on the VPAP scorecard. The legislator might, in fact, put in lots of ill-conceived bills–ideas that haven’t really been thought through very well, poorly designed plays.”
- Or, “a legislator might also end up with a low score by putting in lots of controversial or partisan bills.”
- “On the flip side, a sure way to get a high score is to put in a lot of relatively sleepy little bills–clean up some badly-worded or vague section of the code, solve some minor local problem, be the patron of one of the many, many bills that are voted through unanimously – ‘in the uncontested block.’”
- “…a legislator may get a high score for having a good sense of what can or cannot pass, for working hard with stakeholders and other legislators before and during the process to tweak the language so that it will have as little opposition as possible, for being willing to amend on the fly as needed. Think of this as playing good, smart, fundamentally sound baseball.”
- “But just like a win-loss record is a poor measure of how your pitcher did, and how ‘advanced sabermetrics’ are far more revealing, this VPAP ‘batting average’ is a poor metric for how our legislators did.”
- Also worth looking at, along with the % of patroned bills passed, is how many bills each legislator put in, and how many total bills passed. Thus, clearly having a 100% batting average is not nearly the same thing if you patroned one or two bills that passed versus, let’s say, 40-50 bills, of which perhaps half or two-thirds passed. And again, one really needs to look at how complex, “significant,” etc. each bill is, as well as how much time/effort was required of the patron to get it passed, how much help they had in doing so, etc.
- This year, we saw House Republicans kill a LOT of Democrats’ bills, particularly anything that was in the least bit progressive or pro-environment. Meanwhile, Senate Democrats killed almost all right-wingnut, anti-environment, etc. bills by Republicans. So keep that in mind as you look at the “batting averages.”
- Finally, it’s important to keep in mind that different members of the General Assembly have different roles. Thus, someone in leadership might spend a big chunk of their time…well, leading! As opposed, that is, to worrying as much about their own bills. Or maybe they try to do both. But regardless, the point is, again we’re somewhat comparing apples/oranges/bananas here.
- With all those caveats, there’s an argument that, perhaps, “batting averages” and statistics like the following aren’t even worth presenting. Or maybe they’re worse than nothing, as they could be misleading? I’d argue that, yes, that’s all true, if you just take the “batting averages” alone, and don’t do some serious “advanced sabermetrics,” as Cindy notes. In short, I’d use the following numbers to *start* a conversation, most definitely not to *end* it. With that…here are the numbers, with a few things that jumped out at me (above each graphic)…
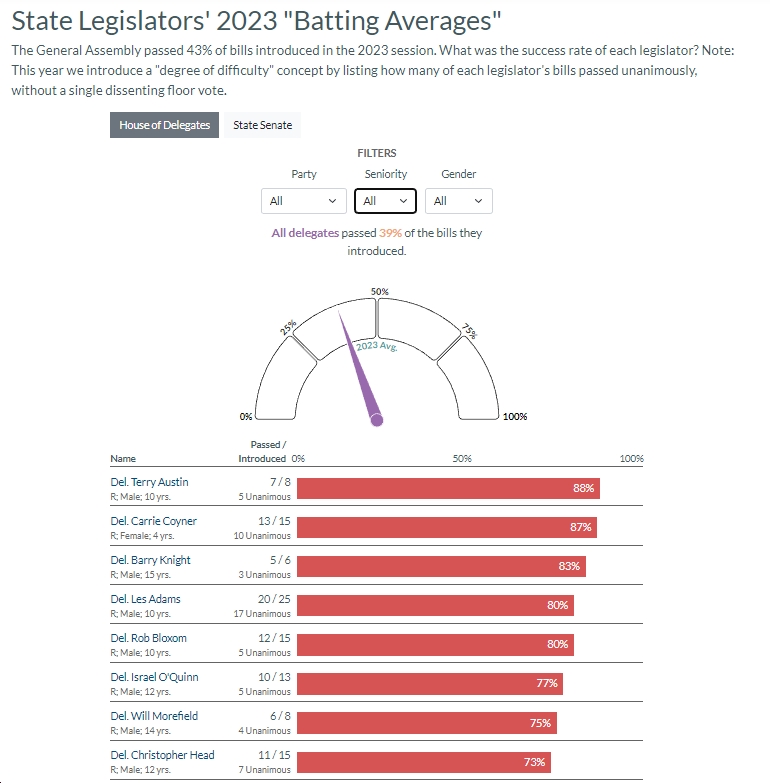
Overall, in the 2023 General Assembly, 43% of introduced bills ended up passing – up slightly from 40% last year but down from 57% in 2021 and 45% in 2020. By party, House Republicans passed 48% of their introduced bills, while House Democrats passed just 27%. Senate Republicans passed 48% of their introduced bills – as did Senate Democrats. Male delegates passed 43% of their introduced bills vs. 32% for female delegates. And male Senators passed 51% of their introduced bills vs. just 38% for female Senators. Delegates with just 0-4 years of seniority passed just 33% of their introduced bills while those with 11-15 years of seniority passed 50% of their introduced bills. You can slice and dice these numbers any way you’d like, so play around with it on VPAP if you’re so inclined.
There’s tons of information here, but a few things that jumped out at me were (in no particular order):
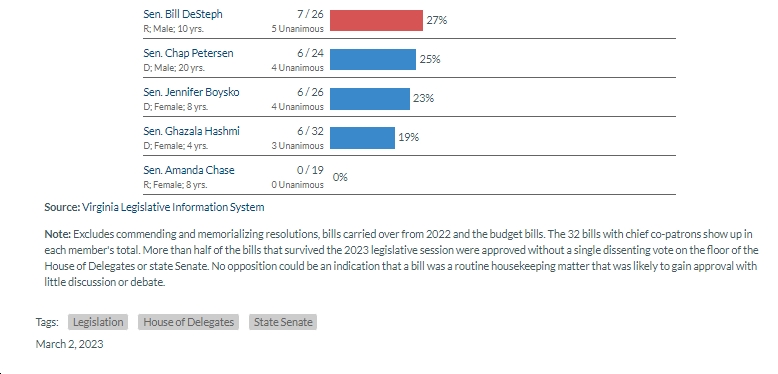
- Extremist/insurrectionist State Senator Amanda Chase, who was censured by her colleagues after the January 6, 2021 insurrection and is disliked by just about everyone, went a whopping ZERO for 19 this year. This wasn’t an aberration for her, as she went ZERO for 23 last year and ZERO for 12 in 2021 and ZERO for 26 in 2020. Chase was also frequently the no vote on 39-1 floor votes. Bottom line: Chase is a completely ineffective, ridiculous legislator who introduces nutty bills (e.g., on ivermectin) and has absolutely no business being a State Senator. WTF, anyone who voted for this complete crackpot?!?
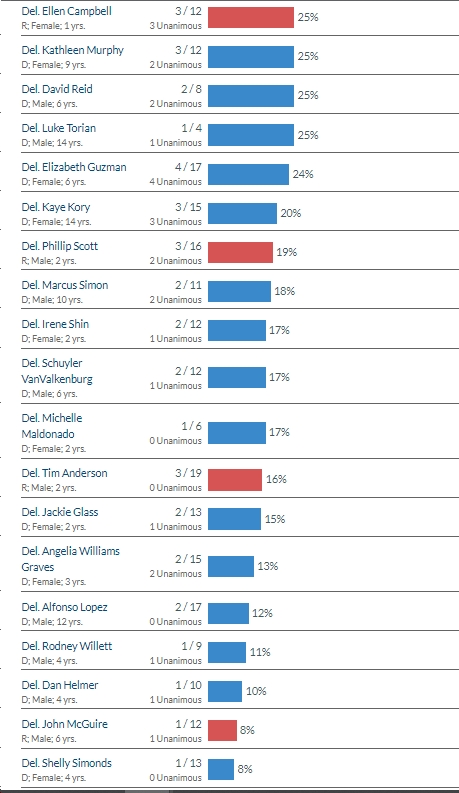
- The top “batting averages” in the Republican-controlled House of Delegates were, not surprisingly, almost all by Republican delegates – Terry Austin, Carrie Coyner, Barry Knight, etc. And no, this is NOT really a reflection of the quality of their bills.
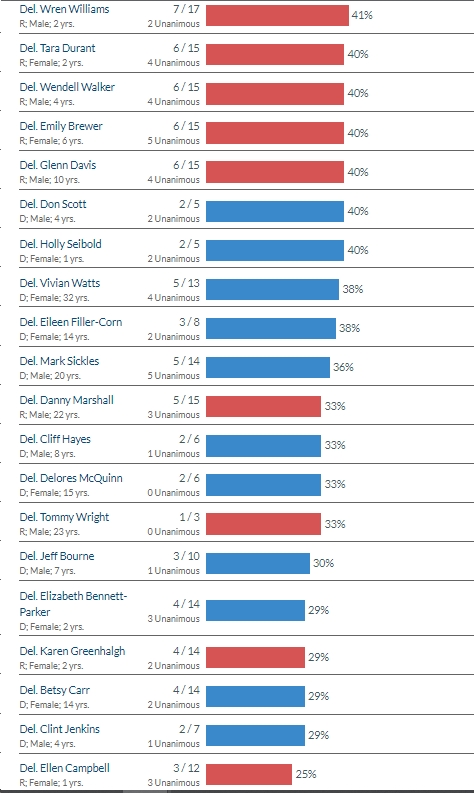
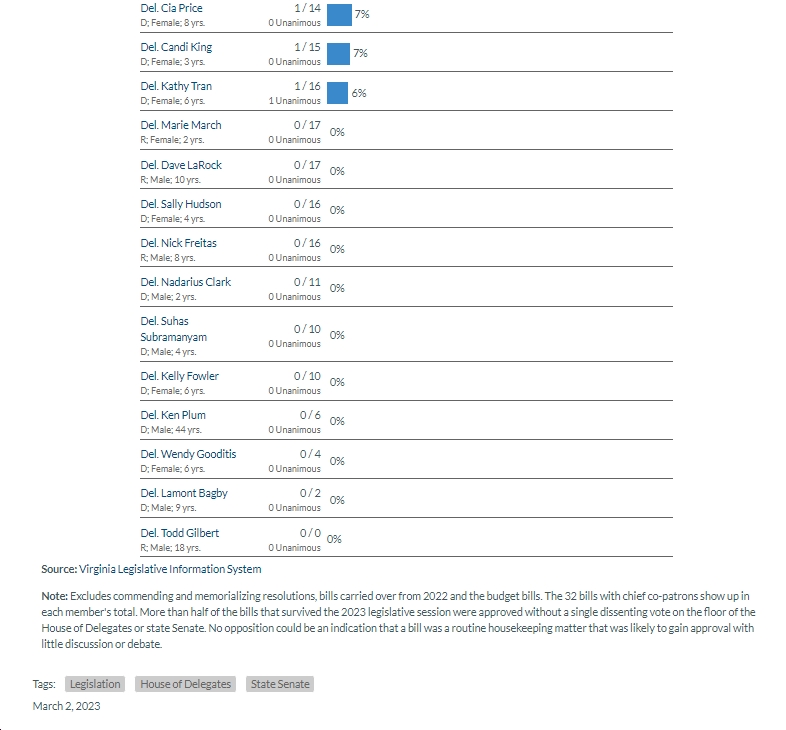
- It’s also not a reflection of any LACK of quality in House Democrats’ bills that Del. Sally Hudson went ZERO for 16, Del. Nadarius Clark went ZERO for 11, Del. Candi King went 1 for 15, Del. Cia Price went 1 for 14, Del. Shelly Simonds went 1 for 13, Del. Dan Helmer went 1 for 10, Del. Alfonso Lopez went 2 for 17, Del. Schuyler VanValkenburg went 2 for 12, Del. Michelle Maldonado went 1 for 6, etc. It’s much more that House Republicans killed anything remotely progressive or pro-environment.
- One of the most far-right delegates, Nick Freitas, went ZERO for 16, putting him in a similar category with other far-right-extremist delegates like Marie March (ZERO for 17), Dave LaRock (ZERO for 17), John McGuire (1 for 12) and Tim Anderson (3 for 19). Ineffective and extremist delegates, what a combo! LOL
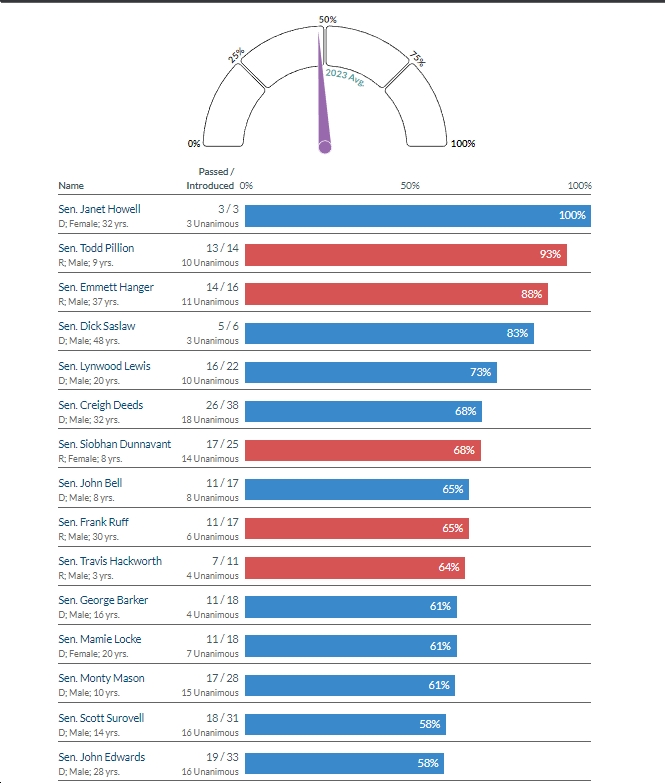
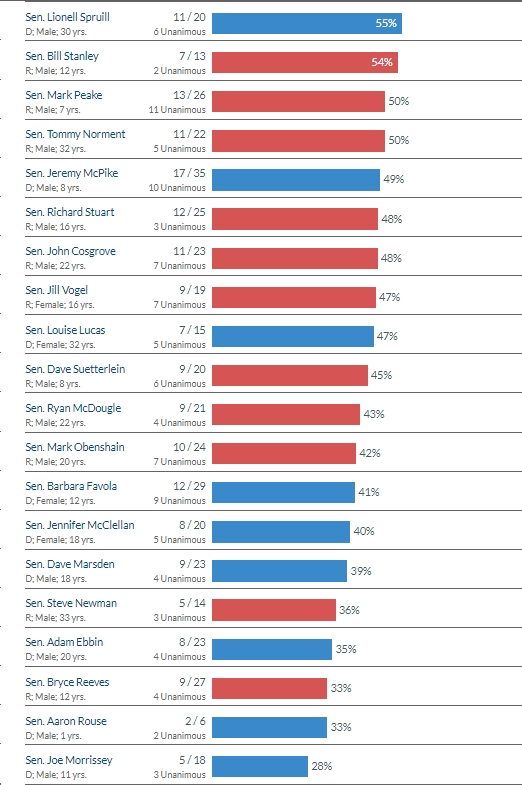
- Several of the higher “batting averages” among State Senators were among more conservative Dems (e.g., Dick Saslaw went 5 for 6, Lynwood Lewis went 16 for 22, John Bell went 11 for 17, Monty Mason went 17 for 28) and by relatively moderate Republican Emmett Hanger (14 for 16). On the other hand, one of the most conservative Senate Dems – Chap Petersen – went just 6 for 24, while another conservative Senate Dem – Joe Morrissey – went just 5 for 18. So it’s a mixed bag.
So what jumps out for you in these statistics?


![Video: Gov. Abigail Spanberger Declares “There is no other option but to have a budget [by 6/30]…every member of the General Assembly…must have that as their priority”](https://bluevirginia.us/wp-content/uploads/2026/06/spanoneonone-350x250.jpg)