The following maps and analysis are courtesy of Chaz Nuttycombe, a 2018 graduate of Hanover High School, DecisionDeskHQ pundit/analyst, and student at J. Sargeant Reynolds Community College (also, see him speaking here at a Richmond March for Our Lives rally). According to Chaz:
These numbers are not based on a model. Instead, I used 2017 turnout to consider county vote weight (how much of the electorate a county makes up). In the “worst case,” I primarily looked at the 2017 gubernatorial race and put small % swings from those results and varied them by how Corey Stewart did in the Republican primaries in the counties. For example, I think Henrico is going to have a larger swing to the left than Dickenson County because: 1) Kaine is loved in Richmond, and 2) Stewart did terribly in both primaries there, while doing well in Dickenson.
For the “standard case,” I analyzed all of the statewide races since 2012 in each county and took into account my precinct predictions I put up on my pinned tweet. The “standard case” is my personal prediction: I think Kaine is going to win by about 19 percentage points. The best case takes the best statewide results from as far back as 2008 (so just including presidential, because Mark Warner’s type of victory is no longer possible in VA), and tries to estimate what a major Kaine win would look like by adding heavy swings from the best margins we’ve gotten, while also taking into account the recent results in the counties, since things have gotten more partisan since 2008. One things for sure: Kaine is going to win handily, it’s just a matter of the margin.
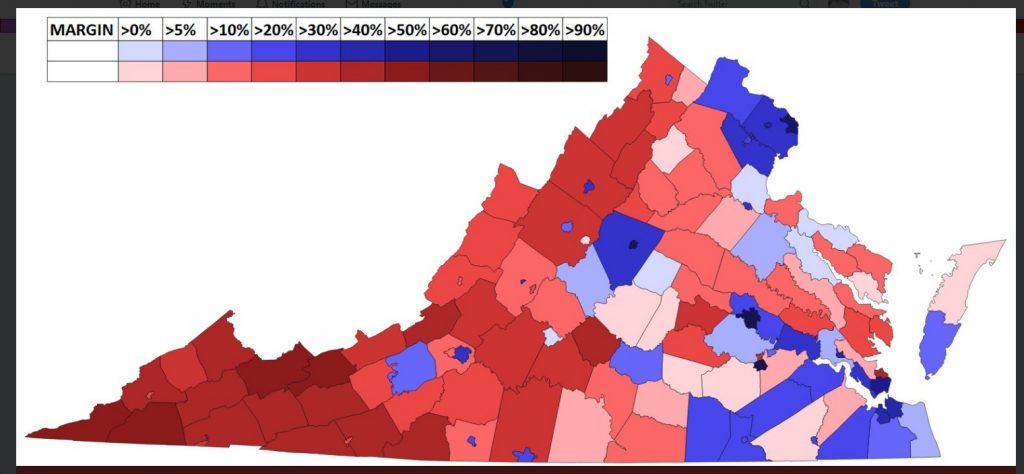
Now, here are the maps (click to enlarge): in order — “worst case,” “standard case,” “best case.”
In the “worst case” map, Chaz predicts that Tim Kaine would beat Corey Stewart by 15.2 points statewide. That includes a 66-point predicted win in Arlington County and a 32-point predicted win in Corey Stewart’s home county of Prince William. Also note the huge Kaine margins on this map in places like Charlottesville, Richmond, Albemarle County, Fairfax County, Loudoun County, Henrico County, Norfolk, Hampton, Roanoke, etc. Corey Stewart’s strong points are, not surprisingly, in places like Southwest Virginia and the Shenandoah region, plus parts of Southside like Appomatox County, Pittsylvania County, etc.
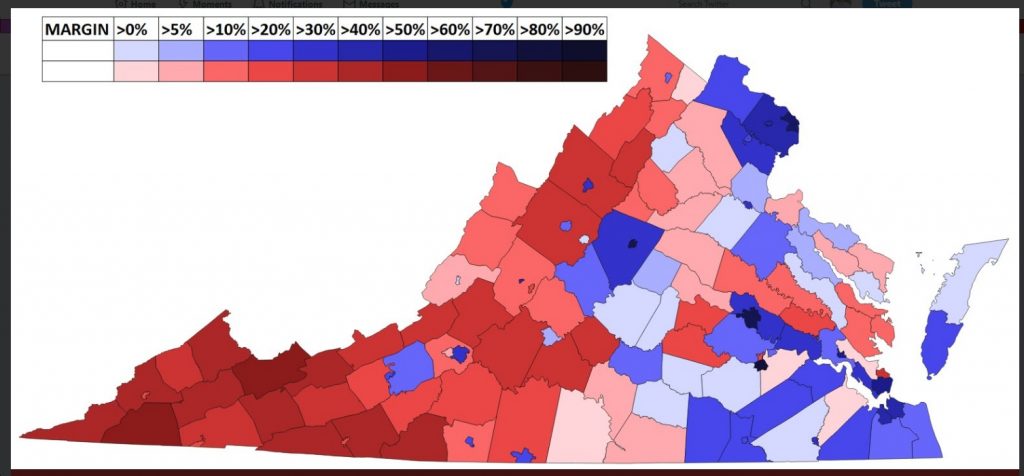
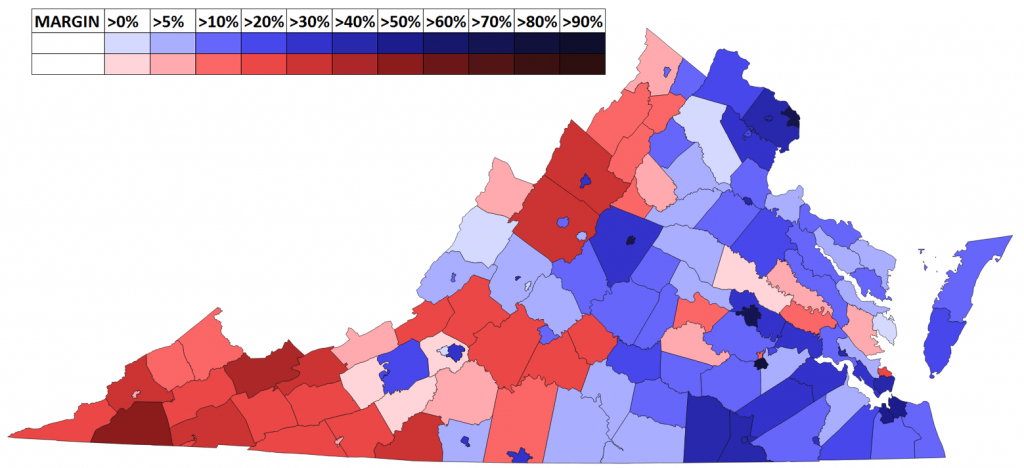
 In the “standard case,” Tim Kaine wins overall by 19.4 points over Corey Stewart. For comparison purposes, note that a recent poll by the University of Mary Washington found Kaine leading Corey 49%-30% (19 points) among all voters and 52%-36% (16 points) among “likely voters.” So Chaz’s “standard case” forecast here seems pretty close to the UMW poll results. Also note that in the “standard case” forecast, Kaine wins “deep-blue” places like Arlington County by 70 points, crushes Corey in Alexandria, Prince William County, Fairfax County, Richmond, Charlottesville, Albemarle and Henrico County (by 34 points there). Basically, in this map, the “blues” get even “bluer” and the “reds” get less “red.”
Finally, in the “best case” map, Tim Kaine wins overall by 27.5 points. I’d say that’s highly optimistic and unlikely, but I guess you never know, as Corey Stewart is an abomination, and hopefully Virginians will resoundingly reject him on 11/6. Anyway…in the “best case” scenario, Chaz predicts that Tim Kaine wins Arlington and Alexandria by about 75 points each; Prince William County by 40 points; Henrico County by 39 points and formerly “red” Chesterfield County by 24 points. Chaz adds that Kaine “dominates in the suburban counties.” As for Corey Stewart, he hangs on only in the “reddest,” Trump-iest parts of Virginia. Of course, this is a “best case” scenario; Chaz argues that the “standard case” numbers are probably more realistic, and I agree.
Finally, just a couple points by me on the potential impact on “downballot” races if the “standard case” scenario comes to pass. In Arlington County, it’s hard to imagine lifelong Republican John Vihstadt (who misleadingly calls himself an “independent”) hanging on if Kaine really wins the county by 70 points. Personally, I’m thinking Kaine wins Arlington by more like 75%-25%, which would be a 50-point win, and still VERY tough for Vihstadt to win, especially if a lot of “federal-only” voters (e.g., who don’t normally follow local politics closely) turn out and vote the straight Democratic ticket (Kaine/Beyer/de Ferranti). I mean, seriously, how many Kaine/Beyer/Vihstadt voters can there possibly be???
In Prince William County, a win of 35 points or so for Tim Kaine over Corey Stewart would make it VERY likely that Democratic School Board Chair candidate Babur Lateef would win. It also would almost certainly spell the end of Corey Stewart’s political career, especially given rumors that Corey’s fellow PW County Board Republican, Martin Nohe, is going to be running for Chair next year. It’s kind of too bad, as I’d love to see a Democrat crush Corey next November and end his political career that way; but either way works,I guess.
With that, what are your thoughts on these maps?
P.S. Here’s one bonus map for your perusal!