
The following graphics, by VPAP, are very helpful in understanding the voter “dropoff” in off/odd Virginia election years, like the one we’re in now, and what that can lead to in terms of election results. The last one of these off/odd election years, of course, was four years ago, in 2015. As VPAP explains:
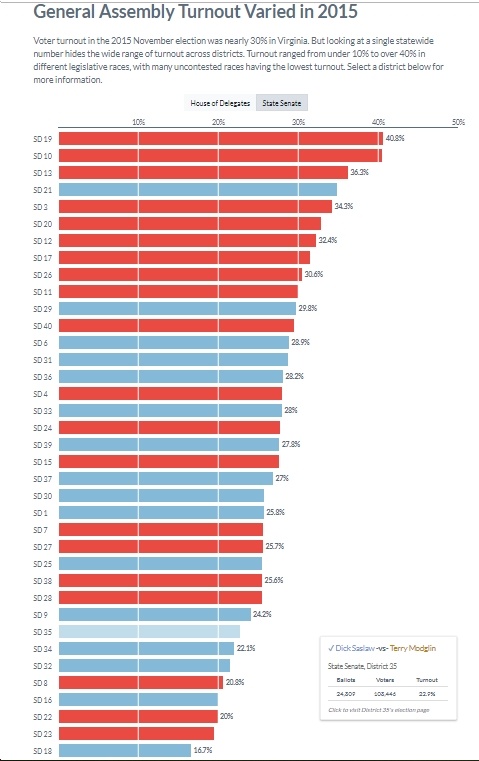
“Voter turnout in the 2015 November election was nearly 30% in Virginia. But looking at a single statewide number hides the wide range of turnout across districts. Turnout ranged from under 10% to over 40% in different legislative races, with many uncontested races having the lowest turnout. Select a district below for more information.”
For comparison purposes to the 30% overall turnout in the November 2015 Virginia legislative elections, the State Board of Elections has turnout statistics for previous election years: 71%-74% turnout in the past three presidential election years (2008, 2012, 2016); 40%-48% in the past three gubernatorial election years (2009, 2013, 2017); 42%-60% in the past three “midterm” federal election years (2010, 2014, 2018).
As you can see, turnout is by far the highest in presidential election years, with turnout generally in the 40%’s in the gubernatorial and mid-term election years (with big “blue wave”/anti-Trump spikes in 2017 and 2018, to 48% and 60%, respectively). Note that when turnout is highest, Democrats generally tend to do much better, such as the sweep of all three statewide offices and the gain of 15 House of Delegates seats in 2017; the landslide victory for Tim Kaine in 2018, as well as the Democratic pickups in VA02 (Elaine Luria), VA07 (Abigail Spanberger) and VA10 (Jennifer Wexton). And when turnout’s lowest, Democrats tend to do the worst, such as in 2009 (the election of Bob McDonnell, Bill Bolling, Ken Cuccinelli and a bunch of Republicans to the House of Delegates), 2010 (the “Tea Party wave” election) and 2014 (another terrible year for Democrats nationally).
But…there’s always a “but,” eh? As VPAP correctly points out, the statewide average turnout for off/odd election years is somewhat misleading, given that there are no statewide races, and also that many General Assembly races historically were uncontested and/or non-competitive (e.g., safe “red” or safe “blue”). How was turnout in State Senate and House of Delegates districts that *were* contested and/or competitive? Higher, no question, although still not great. For instance, here are a few highlights from 2015 State Senate contests (see following the Senate graphics for House of Delegates highlights):
- Check out the SD10 race in 2015, which was an open seat, highly competitive, and a top Democratic target, which saw millions of dollars spent by the Democratic and Republican candidates – Dan Gecker and Glen Sturtevant, respectively. That district saw 40.6% turnout, which is edging closer to gubernatorial-level turnout, although still not extraordinary by any means. And, not coincidentally, that “meh” turnout resulted in the Democrat (Dan Gecker) losing narrowly, despite this being a Democratic-leaning district. Of course, the fact that Gecker was barely even a Democrat, having called himself an “independent” previously, very well might have contributed to lack of enthusiasm in SD10’s Democratic “base.” Which, in turn, demonstrates how these off/odd election years hinge heavily on exciting the parties’ respective bases to turn out on election day.
- One other high-profile State Senate was in SD13, between right-wing Republican and Democrat Jill McCabe (wife of former FBI Deputy Director Andrew McCabe). Turnout in that race, where about $2.5 million was spent, was 36.3%, which again wasn’t great compared to gubernatorial or mid-term election years, but nonetheless was one of the highest turnout percentages in 2015 for State Senate. And, again, Democrats lost, again fairly narrowly (52%-48%).
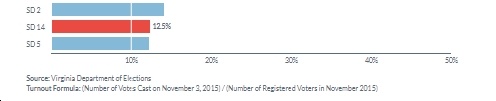
- At the other end of the spectrum, check out the horrendously low turnout in State Senate districts that are totally safe for one party or the other and/or uncontested. For instance, in SD5 (uncontested/safe Democratic/incumbent Sen. Kenny Alexander), turnout was just 12.3%. Or how about SD14 (uncontested/safe Republican/incumbent Sen. John Cosgrove), where turnout was just 12.5%? Also seeing super-low turnout were safe/uncontested State Senate districts like SD2 (safe D/incumbent Sen. Mamie Locke) at 14.2%, SD18 (safe D/incumbent Sen. Louise Lucas) at 16.7%, SD23 (safe R/incumbent Sen. Steve Newman) at 19.6%, SD22 (safe R/incumbent Sen. Tom Garrett) at 20%. Sensing a pattern?
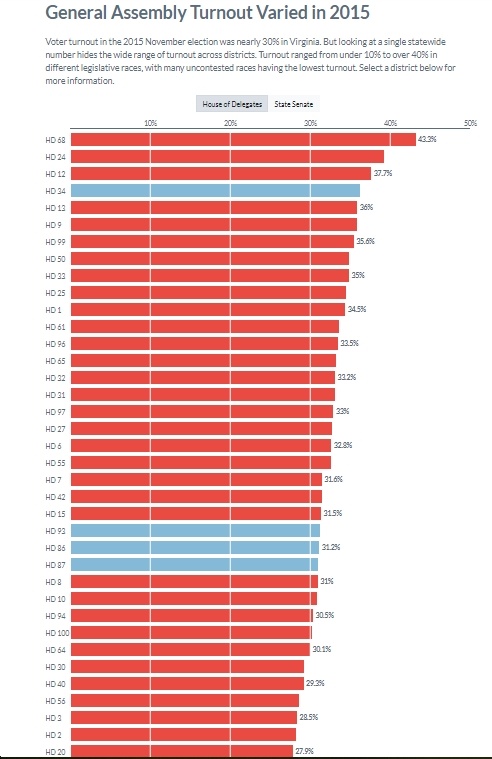
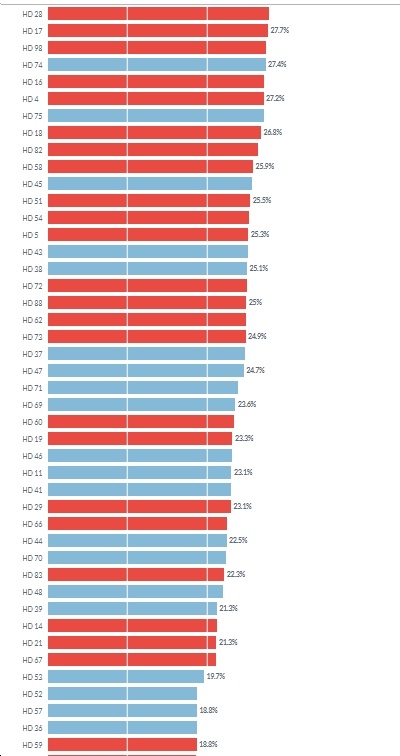
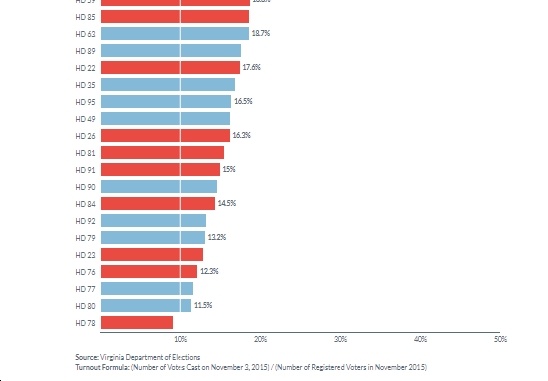
- House of Delegates races in 2015 showed a similar pattern to the State Senate races, with the highest turnout tending to be in competitive and/or contested seats, and with the lowest turnout generally seen in the non-competitive and/or uncontested seats.
- For instance, the lowest turnout (just 9.2%) was in non-competitive/uncontested HD78. Also seeing super-low turnout were safe Democratic/non-contested HD77 (11.7%), HD79 (13.2%), HD80 (11.5%), HD92 (13.4%) and safe Republican and/or non-contested HD23 (13.0%), HD76 (12.3%), HD84 (14.5%), HD91 (15.0%), etc.
- A few competitive/contested races saw relatively high turnout. For instance, check out HD34 (Democrat Kathleen Murphy vs. Republican Craig Parisot), which saw 36.4% turnout in a tight race that ended up decided by under 200 votes (10,820-10,632) out of more than 21,000 cast.
- Also check out HD13, currently represented by Del. Danica Roem, which in 2015 saw a hot race between far-right Republican Del. Bob Marshall and Democrat Don Shaw. The final results were 56%-44% for Marshall, with around $330,000 spent, and with turnout of 36%. Again, that’s relatively good turnout for the 2015 election cycle, but still ridiculously low compared to turnout in every other election year. For instance, in 2017, Democrat Danica Roem won that district 54%-46%, with turnout of more than 22,000 voters, nearly double the 12,739 voters who showed up in 2015 (when Republican Bob Marshall won). In other words, depending on turnout levels, HD13 can be a VERY different district, from an 8-point Democratic district to a 12-point Republican district…and everything in between.
- This isn’t just the case in HD13, either, but in many Virginia House of Delegates districts, where high turnout can make the district look nicely “blue,” while very low turnout can make it look somewhat or even solidly “red.” Which, again, confirms the saying that “when people vote, Democrats win,” or to put it the other way, “when people do NOT vote, Republican win.” Which raises the big question for this November’s elections – will people show up to vote in large numbers, medium numbers, or small numbers? If the former, it’s likely that Democrats will have a great night on November 5. If the latter, it could be a very long night. Let’s make sure we make it the former scenario…by showing up and voting in droves!


 Talks About GOP War on Voting Rights, Immigrants; Right-Wing “Backlash” Involving “propaganda,violence and voter suppression”")