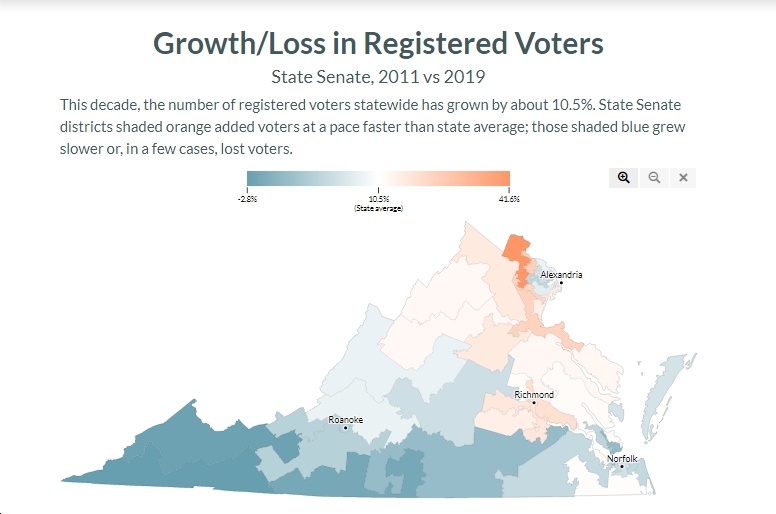
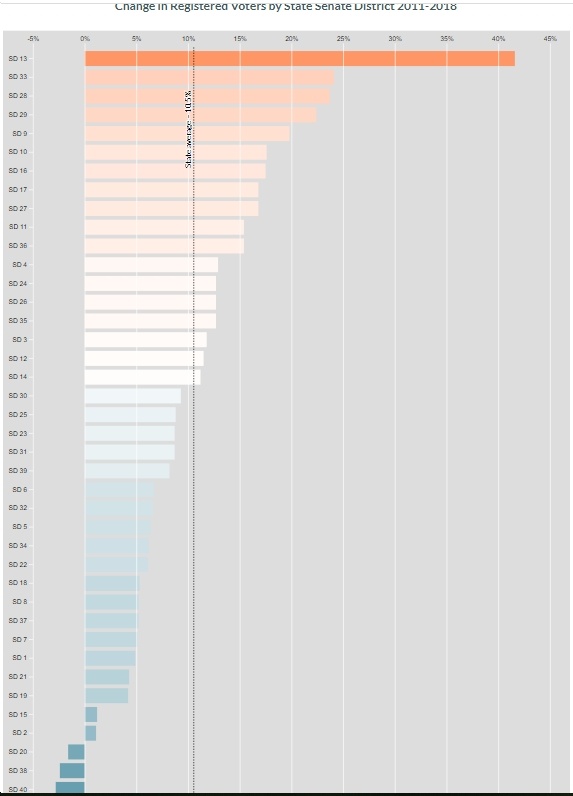
The following graphics, from VPAP, are fascinating, in that they show at a glance which Virginia State Senate districts gained/lost registered voters in the last decade. Overall, as the first graphic points out, registered voters grew 10.5% statewide between 2011 and 2019. But, as you can also clearly see from the graphic, this growth was NOT even across Virginia.
Instead, we actually saw *declines* in the number of registered voters in SD40 (-2.8%), SD38 (-2.4%), SD20 (-1.6%) – all “bright-red”/Republican State Senate districts located in Southwestern and/or Southside Virginia. We also can see from the map that most of Southwestern and Southside Virginia were below the statewide average in terms of growth in registered voters this past decade, while most of Northern Virginia and the Richmond area were at or above average. And that, of course, reflects the shifting center of power in Virginia, as exemplified by the new Democratic House and Senate majorities, which are heavily based in those areas, plus Hampton Roads.
In contrast, there were large *gains* in the number of registered voters in SD13 (+41.6%), SD33 (+24.1%), SD28 (+23.7%), SD29 (+22.4%), SD9 (+19.8%), SD10 (+17.6%), SD16 (+17.5%), SD17 (+16.8%), SD27 (+16.8%), SD11 (+15.4%), SD36 (+15.4%) – mostly in Northern Virginia and the Richmond area – most of which are either Democratic or competitive/trending Democratic. So…basically, in the next redistricting, Democrats should gain and Republicans should lose, simply based on the shifting demographics of Virginia. We’ll see, though, how the redistricting is done, exactly, whether truly “nonpartisan” (highly unlikely that will happen), “bipartisan” (that’s possible, but the devil’s in the details), or a “partisan gerrymander” (probably not going to happen, but you never know…).


![Video: VA Del. Jessica Anderson Pushes Back on Right-Wing “Ragebait,” “Wild Assumption[s],” Distortions and Hyperbole, etc. Against Random Bills](https://bluevirginia.us/wp-content/uploads/2026/02/anderson347-238x178.jpg)


![Video: Former Rep. Barbara Comstock (R-VA10) Says “In one short year, [Trump] has destroyed” the Kennedy Center](https://bluevirginia.us/wp-content/uploads/2026/02/comstocknewshour-100x75.jpg)

