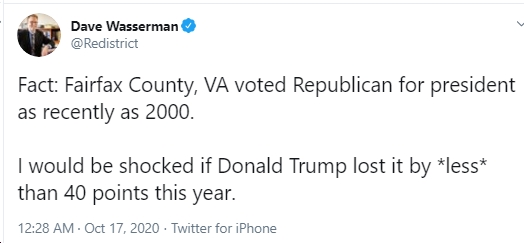
A tweet by Dave Wasserman of the Cook Political Report (see below) noted that Fairfax County last voted Republican for president in 2000. That got me thinking about how some of the biggest jurisdictions in Virginia have changed over the years in terms of their partisan breakdown in major, federal (U.S. Senate, presidential) elections, and also when the county “tipped” from “red” to “blue.” Also, see my thoughts on what we might see in the 2020 election, and feel free to weigh in…
Fairfax County – As Dave Wasserman noted, Fairfax County last voted Republican for president in 2000, then “tipped” in 2004 (John Kerry by 7.3 points) and 2006 (Jim Webb by 18.8 points), with the “blue” margin reaching 35.8 points in 2016 and 44.0 points in 2018. How about 2020? I’d guess it will look something like Tim Kaine’s win over Corey Stewart in 2018, but with even larger turnout, hence a larger absolute margin for Biden over Trump (and also for Mark Warner over Daniel Gade, of course). What do you think?
2000: Gore lost Fairfax County 47.5%-48.9% (-1.4 pts)
2004: Kerry won Fairfax County 53.2%-45.9% (+7.3 pts)
2006: Webb won Fairfax County 58.9%-40.0% (+18.8 pts)
2008: Obama won Fairfax County 60.1%-38.9% (+21.2 pts)
2012: Obama won Fairfax County 59.4%-39.0% (+20.4 pts)
2016: Clinton won Fairfax County 64.4%-28.6% (+35.8 pts)
2018: Kaine won Fairfax County 70.9%-26.9% (+44.0 pts)
2020: Biden will win Fairfax County by…?
Prince William County – Was mostly “red” until 2006, when it barely (2.4 points) went for Jim Webb over George Allen; has turned MUCH “bluer” since, hitting a 31.9-point margin for Tim Kaine in 2018. This time around, I’d guess we’ll see an even larger percentage margin, again on higher turnout than in 2018, hence a larger absolute margin for Biden over Trump (and also for Mark Warner over Daniel Gade, of course).
2000: Gore lost Prince William County 44.5%-52.5% (-8.0 pts)
2004: Kerry lost Prince William County 46.4%-52.8% (-6.4 pts)
2006: Webb won Prince William County 50.5%-48.1% (+2.4 pts)
2008: Obama won Prince William County 57.5%-41.6% (+15.9 pts)
2012: Obama won Prince William County County 57.3%-41.3% (+16.0 pts)
2016: Clinton won Prince William County County 57.6%-36.5% (+21.1 pts)
2018: Kaine won Prince William County 64.9%-33.0% (+31.9 pts)
2020: Biden will win Prince William County County by…?
Loudoun County – Was “red” until it “tipped” in the 2006 federal elections, narrowly (1.4 points) going for Jim Webb over George Allen; then ballooned to a 16.9-point margin for Hillary Clinton in 2016 and a 28.4-point margin for Tim Kaine in 2018. This time? I’d guess higher turnout AND a higher margin than in 2018, both in percentage and in absolute terms, this time for Biden over Trump (and also for Mark Warner over Daniel Gade, of course).
2000: Gore lost Loudoun County 40.9%-56.1% (-15.2 pts)
2004: Kerry lost Loudoun County 43.6%-55.7% (-12.1 pts)
2006: Webb won Loudoun County 50.1%-48.7% (+1.4 pts)
2008: Obama won Loudoun County 53.7%-45.4% (+8.3 pts)
2012: Obama won Loudoun County 51.5%-47.0% (+4.5 pts)
2016: Clinton won Loudoun County 55.1%-38.2% (+16.9 pts)
2018: Kaine won Loudoun County 63.1%-34.7% (+28.4 pts)
2020: Biden will win Loudoun County by…?
Henrico County – Was “red” until 2005, then basically went “purple” in 2006, before definitively switching to “blue” in 2008, and then ballooning to a massive, 32.4-point margin for Tim Kaine in 2018. This time around? I’d guess Henrico goes to Biden by an even larger percentage AND absolute margin than in 2018(and also for Mark Warner over Daniel Gade, of course).
2000: Gore lost Henrico County 42.6%-55.0% (-12.4 pts)
2004: Kerry lost Henrico County 45.6%-53.8% (-8.2 pts)
2006: Webb lost Henrico County 49.1%-49.7% (-0.6 pts)
2008: Obama won Henrico County 55.7%-43.5% (+12.2 pts)
2012: Obama won Henrico County 55.0%-43.3% (+11.7 pts)
2016: Clinton won Henrico County 57.4%-36.6% (+20.8 pts)
2018: Kaine won Henrico County 65.2%-32.8% (+32.4 pts)
2020: Biden will win Henrico County by…?
Arlington County – Was “blue” in 2000, but only by 25.9 points, whereas in 2018 Arlington went by 66.2 points (!) for Tim Kaine. This time around? Again, I think there will be a larger margin in absolute terms from Arlington for the “blue team” – Biden/Harris – with turnout off the charts. I’m not sure the “blue” percentage can really increase much more…maybe a bit higher than 81.6%?
2000: Gore won Arlington County 60.1%-34.2% (+25.9 pts)
2004: Kerry won Arlington County 67.6%-31.3% (+36.3 pts)
2006: Webb won Arlington County 72.6%-26.3% (+46.3 pts)
2008: Obama won Arlington County 71.7%-27.1% (+44.7 pts)
2012: Obama won Arlington County 69.1%-29.3% (+39.8 pts)
2016: Clinton won Arlington County 75.9%-16.6% (+59.3 pts)
2018: Kaine won Arlington County 81.6%-15.4% (+66.2 pts)
2020: Biden will win Arlington County by…?
Virginia Beach – Was “red” for sure in 2000 and 2004, then “red” but closer in 2006, before heading towards “purple” status in 2008, 2012 and 2016 (in each case it narrowly went to the Republican), before going “blue” by 10.8 points in 2018. This time around? I’m confident that Biden will win Virginia Beach, but I’m skeptical that he’ll surpass Kaine’s 2018 percentage margin…same thinking for Warner over Gade.
2000: Gore lost Virginia Beach 41.6%-55.9% (-14.3 pts)
2004: Kerry lost Virginia Beach 40.2%-59.1% (-18.9 pts)
2006: Webb lost Virginia Beach 46.5%-52.3% (-5.8 pts)
2008: Obama lost Virginia Beach 49.1%-49.8% (-0.7 pts)
2012: Obama lost Virginia Beach 47.9%-50.4% (-2.5 pts)
2016: Clinton lost Virginia Beach 44.8%-48.3% (-3.5 pts)
2018: Kaine won Virginia Beach 54.2%-43.4% (+10.8 pts)
2020: Will Biden win Virginia Beach? If so, by…?
Richmond City – Has been “blue” during this whole timespan, although getting “bluer” as the years go by. I’d expect higher turnout in 2020 than in 2018, with similar percentage margins (+70.9 points) to what we saw then for Kaine, producing a larger *absolute* margin this time around than in 2018.
2000: Gore won Richmond City 64.8%-30.7% (+34.1 pts)
2004: Kerry won Richmond City 70.2%-29.1% (+41.1 pts)
2006: Webb won Richmond City 71.7%-26.9% (+44.8 pts)
2008: Obama won Richmond City 79.1%-20.0% (+59.1 pts)
2012: Obama won Richmond City 77.7%-20.5% (+55.2 pts)
2016: Clinton won Richmond City 78.5%-15.1% (+63.4 pts)
2018: Kaine won Richmond City 84.5%-13.4% (+70.9 pts)
2020: Biden will win Richmond City by…?
Chesterfield County – Such an interesting and amazing transition, going from a county that was SOLIDLY “red” in 2000, 2004 and 2006, before getting closer to competitive (but still “red”) in 2008 and 2012, then getting *really* competitive in 2016, then flipping to “blue” in 2018 (Kaine by 9.9 points!). This time around? I’d expect higher turnout, and possibly a similar or slightly lower percentage margin to Kaine in 2018. How about you?
2000: Gore lost Chesterfield County 34.8%-63.0% (-28.2 pts)
2004: Kerry lost Chesterfield County 36.9%-62.6% (-25.7 pts)
2006: Webb lost Chesterfield County 40.3%-58.4% (-18.1 pts)
2008: Obama lost Chesterfield County 45.8%-53.3% (-7.5 pts)
2012: Obama lost Chesterfield County 45.4%-53.1% (-7.7 pts)
2016: Clinton lost Chesterfield County 45.9%-48.2% (-2.3 pts)
2018: Kaine won Chesterfield County 54.0%-44.1% (+9.9 pts)
2020: Biden will win Chesterfield County? If so, by…?