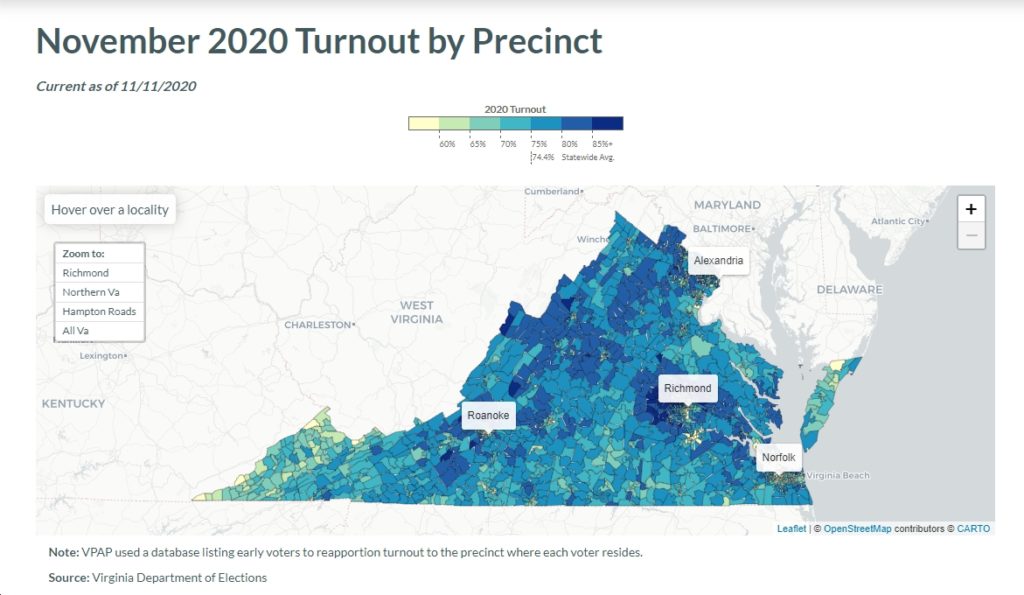
There was a massive amount of early voting this election cycle, which means that specific precinct data’s not going to be exact, but the following map from VPAP says that it “used a database listing early voters to reapportion turnout to the precinct where each voter resides.” So hopefully that’s pretty close to what actually happened on Election Day. Assuming this methodology is accurate – or at least close – here’s what turnout by precinct in Virginia looked like in Election 2020.
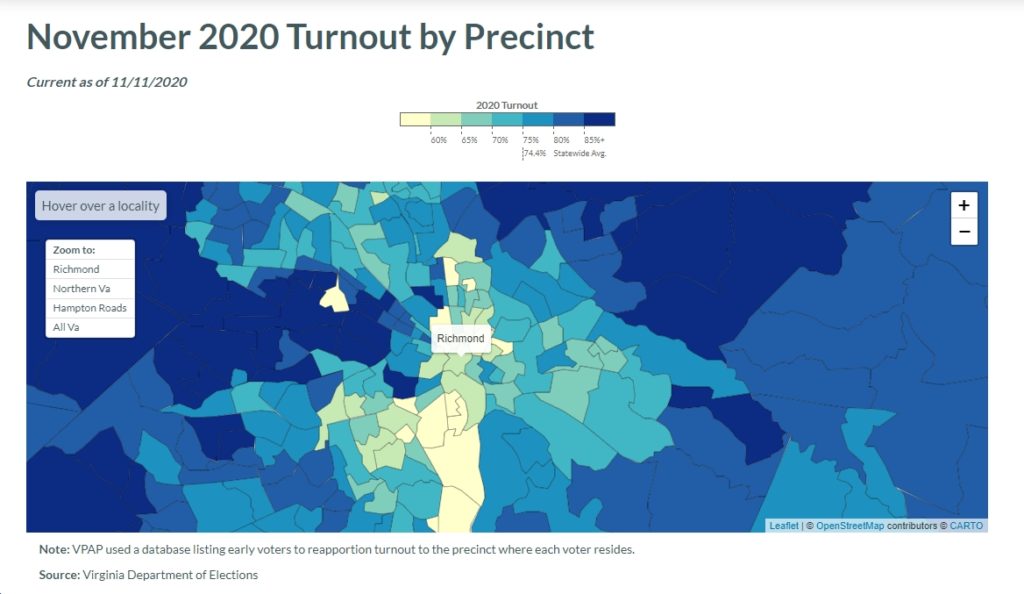
- The lightest colors/lowest % turnout seem to be concentrated in far-southwestern Virginia, in Richmond City, in Petersburg, to an extent in Southside, and other than that mostly scattered throughout Virginia.
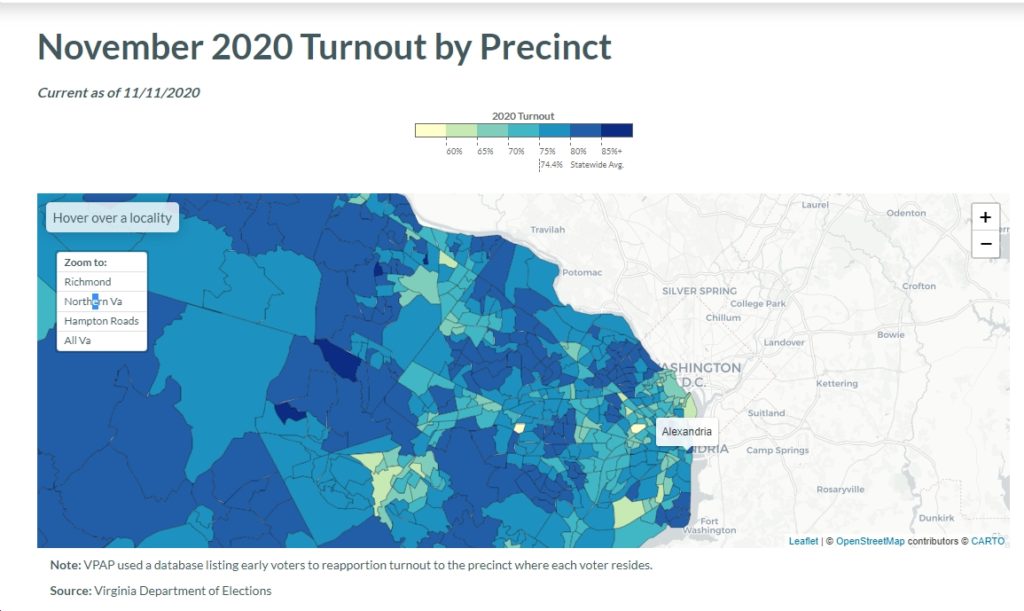
- The darkest colors/highest % turnout are in places like Loudoun County, Fairfax County, Henrico County, Chesterfield County, Hanover County, Montgomery County, Rockbridge County, Highland County, Rockingham County, Arlington County, Fauquier County, Culpeper County, etc. A mix of “red” and “blue” politically speaking…
- A few of the highest-turnout precincts on the map are: Ashby Ponds in Loudoun County (88.1%), Alvey in Loudoun County (86.3%), Mill Run in Loudoun County (85.3%), Pinebrook in Loudoun County (85.1%), Singers Glen in Rockingham County (85.2%), Mill Gap in Highland County (88.1%), Effinger in Rockbridge County (85.3%), Mechums River in Albemarle County (85.3%), Elk Creek in Louisa County (85.7%), Wilmington Parish in Hanover County (88.6%), Courthouse in Hanover County (86.7%), Georgetown in Hanover County (87.2%), Shallow Well in Goochland County (86.5%), Pineville in Powhatan County (87.3%), Totopotomoy in Hanover County (87.1%), Studley in Hanover County (87.8%), etc. If anything, there seem to be more “red” than “blue” precincts in here…
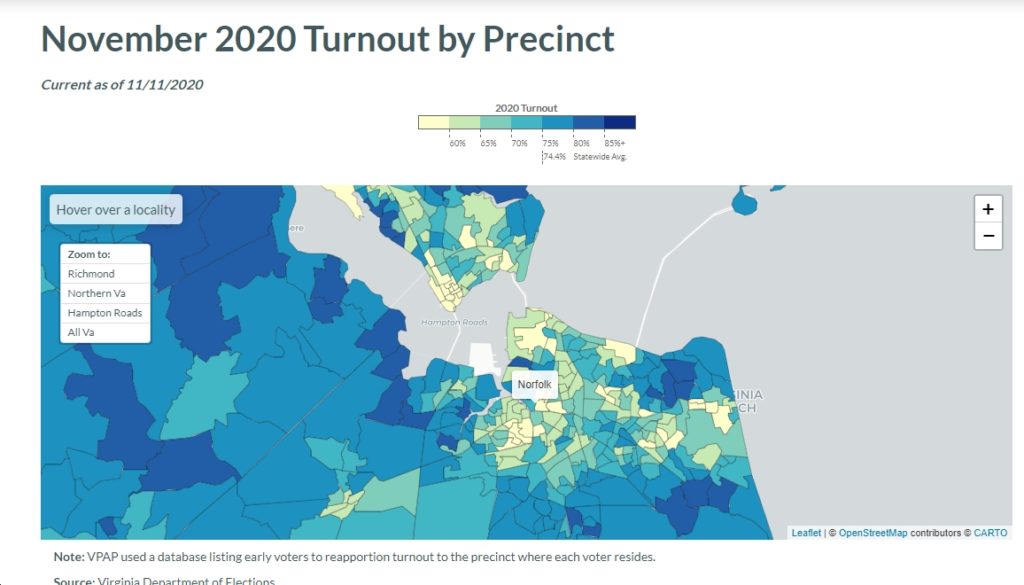
- Some of the lowest-turnout precincts include University in Fairfax County (27.1%), Quantico in Prince William County (41.1%), University in Albemarle County (40.5%), Dunbar in Newport News (38.5%), East Hampton in Hampton City (26.5%), Richmond #306 (48.5%), Richmond #701 (47.9%), Richmond #101 (46.1%), Lynchburg Second Ward Third Precinct (55.8%), Forest Park in Roanoke City (52.7%), Pecinct E-3 in Montgomery County (24.1%), Precinct F-3 in Montgomery County (23.6%), Elydale in Lee County (58.0%), St. Charles in Lee County (48.2%), etc. Definitely note the low turnout at university precincts, which is in large part due to students not being on campus.
- Some counties showed major disparities. For instance, Prince William County showed some relatively percentages (e.g., 64.9% in Dale, 60.3% in Westgate) – both very “blue” – and some high percentages (e.g., 80.3% in Brentsville, 81.6% in McCoart, 80.1% in Coles) – both very “red.”
- One of the lowest percentages was in Fairfax County’s “University” precinct, at just 27.1%…presumably because GMU students mostly aren’t on campus due to COVID-19.
- What else jumps out at you?