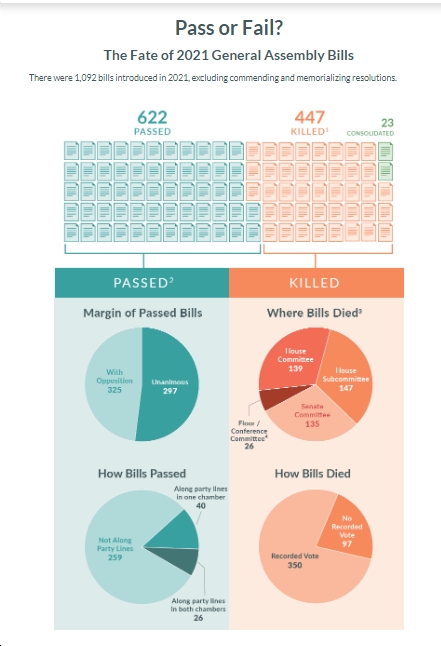
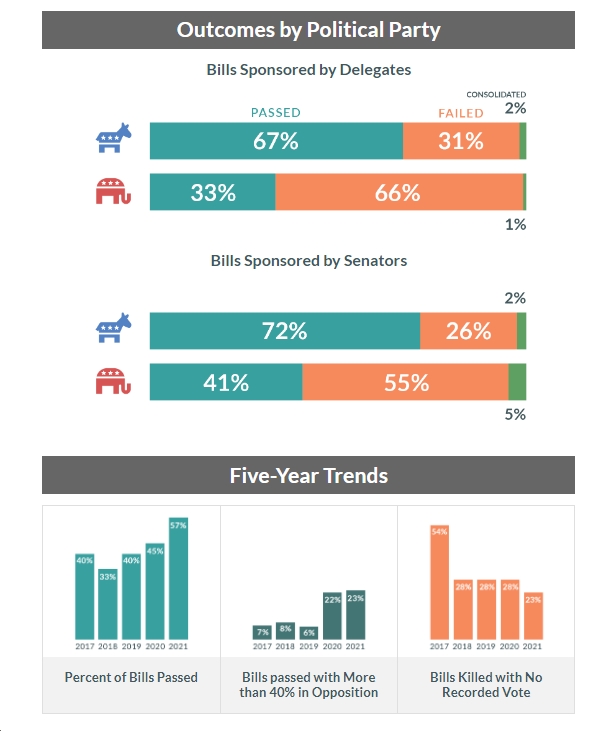
It’s interesting to compare these new graphics from VPAP – on the “fate of 2021 General Assembly Bills” – with those from yesterday, on key progressive legislation passing the Virginia House of Delegates and State Senate on almost strict party-line votes. As these new graphics illustrate, 67% of House Democrats’ bills passed this year, compared to just 33% of Republicans’ bills; and 72% of Senate Democrats’ bills passed this year, compared to just 41% of Senate Republicans’ bills. The trend over the past five years (note: Dems took control of the General Assembly in January 2020) show the percent of bills passing has increased from just 33% in 2018, when Republicans were in charge, to 57% in 2021, with Democrats in charge. Also note that the percent of bills passed with more than 40% in opposition jumped from 6% in 2019, when Republicans were in charge, to 22% last year and 23% this year, when Democrats were in charge. Innnteresting, eh? Oh, and the percent of bills killed without a recorded vote has fallen sharply from 54% in 2017, when Republicans were in charge, to 23% now…
Also of note: today’s graphics show that, out of 1,092 bills introduced in 2021, a total of 662 passed, while 447 were killed and 23 “consolidated.” Of the 447 bills that were killed, 135 died in Senate committees, while 286 met their demise in House committees or subcommittees, with 26 being killed on the floor or in conference committees.


![Saturday News: “Trump’s latest tariff TACO probably won’t make your life more affordable”; “The Epstein Email Cache: 2,300 Messages, Many of Which Mention Trump”; “[MTG] questions if Trump is still the ‘America First’ president”; “Jim Ryan tells all: ‘What did the Governor know, when did he know it?’”](https://bluevirginia.us/wp-content/uploads/2025/11/montage1115-238x178.jpg)


![Saturday News: “Trump’s latest tariff TACO probably won’t make your life more affordable”; “The Epstein Email Cache: 2,300 Messages, Many of Which Mention Trump”; “[MTG] questions if Trump is still the ‘America First’ president”; “Jim Ryan tells all: ‘What did the Governor know, when did he know it?’”](https://bluevirginia.us/wp-content/uploads/2025/11/montage1115-100x75.jpg)
