Last week, Cindy/VAPLAN came out with her eagerly anticipated, annual progressive scorecard for all Virginia General Assembly members. As always, there is a TON of information to digest in all of this. Of course, as Cindy has pointed out, there are numerous caveats to these scores, for instance that members “have different opportunities to vote on various bills, by virtue of the committee assignments they have.” I’d also add that different members have different roles, with those in leadership, for instance, not necessarily working to optimize their OWN scores, but instead (or at least somewhat) focusing on racking up wins for the “team.” Still, I think that Cindy/VAPLAN does amazing work, and that the scorecard she produces every year is the most authoritative/definitive one out there for the Virginia legislature (also note: Cindy follows the Virginia General Assembly arguably closer than almost anyone else in Virginia, and maybe in the country when it comes to state legislatures).
With that, I wanted to compare the 2023 VAPLAN scores to district “leans,” along the lines of what Progressive Punch has been doing for years. Basically, the thinking is to try and measure how progressive a member’s voting record is compared to how progressive one would have expected that record to be, all else being equal, based on the progressive “lean” of each member’s district.
To measure the district’s “leans,” I took the 2017 margins in each district for Mark Herring. I used that metric because I wanted a relatively generic statewide race to compare things to, without a third-party candidate or strong “native son” effect (e.g., Northam in the Hampton Roads area). Also note that the redistricting “special masters” in their final memo on 12/7/21 used the 2017 Attorney General’s race to evaluate their newly drawn districts. Of course, 2017 was a strong “blue wave” election year, so one could argue that we should use another statewide election year, such as 2021 (which was a strong Republican year), but in the end, there’s simply no way to find the “perfect” comparison year, and regardless, all the members’ scores are *relative* to their district leans, and then ranked accordingly, so it might not make much of a difference anyway.
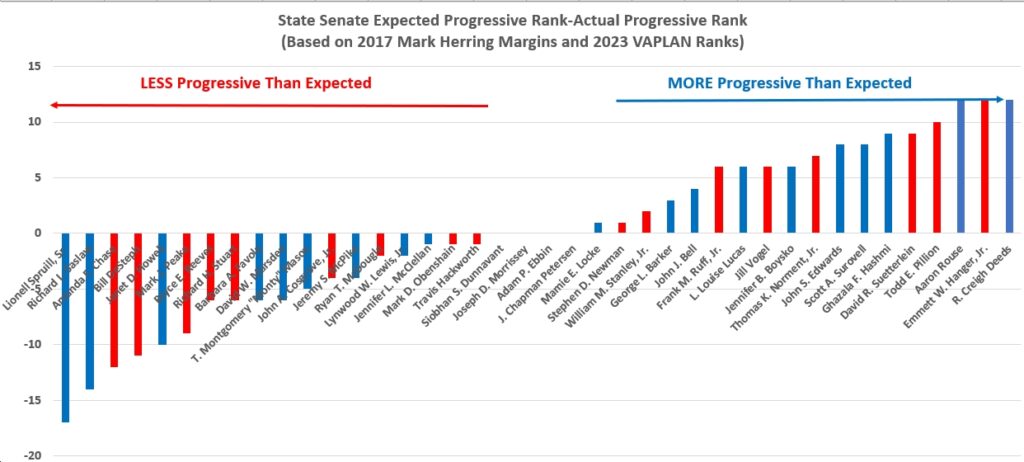
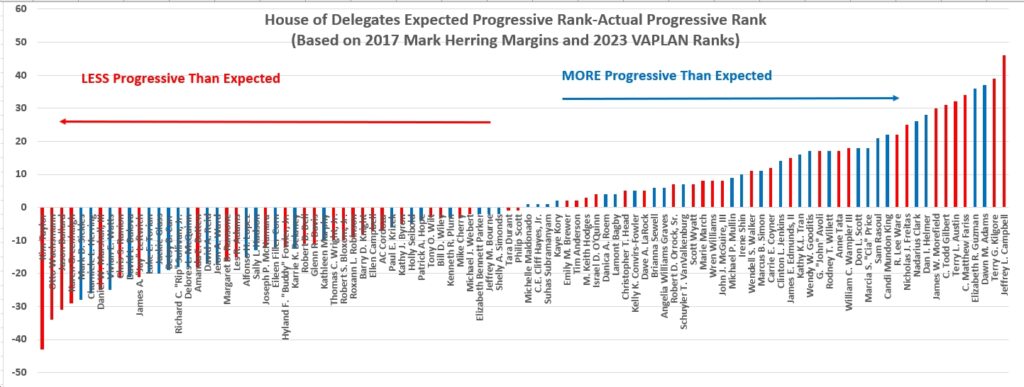
I then ranked the districts based on Mark Herring margins, giving an expected progressive rank, and compared those numbers to VAPLAN’s actual progressive rankings for each legislator. Finally, I produced the following graphics (click on them to enlarge), which show how much MORE or LESS progressive than one would expect – based on district lean – each member of the House of Delegates and State Senate ended up scoring in the 2023 General Assembly session.
Note, by the way, that Cindy/VAPLAN and I used district leans based on PREVIOUS (and still current) district lines, since the new districts won’t fully “kick in” until January 2024 (and yes, we know, it’s kinda crazy it takes so long…four years into the new decade). So keep in mind that some of these legislators will find themselves in much “redder” or bluer” districts, and are quite possibly adjusting their voting accordingly.
With that, here are some highlights.
- In the State Senate, 18 members scored less progressive than expected based on their districts’ “leans,” while 18 members scored more progressive than expected based on their districts’ “leans,” and 4 members (Republican Senator Siobhan Dunnavant; Democratic Senators Joe Morrissey, Adam Ebbin and Chap Petersen) scored exactly as one would expect based on their districts’ 2017 AG race outcomes.
- Among Senate Democrats, the members who voted less progressively than their districts’ progressive “leans” would imply are: Lionell Spruill (expected rank was 2, actual rank was 19, for a MINUS 17 score); Janet Howell (expected rank was 6, actual rank was 16, for a MINUS 10 score); Senate Majority Leader Dick Saslaw (expected rank was 4, actual rank was 18, for a MINUS 14 score); Barbara Favola (expected rank was 7, actual rank was 13, for a MINUS 6 score); Dave Marsden (expected rank was 14, actual rank was 20, for a MINUS 6 score); Monty Mason (expected rank was 16, actual rank was 21, for a MINUS 5 score); Jeremy McPike (expected rank was 10, actual rank wsa 14, for a MINUS 4 score); Lynwood Lewis (expected rank was 20, actual rank was 22, for a MINUS 2 score); Jennifer McClellan (expected rank was 1, actual rank was 2, for a MINUS 1 score).
- Among Senate Republicans, the members who voted less progressively than their districts’ progressive “leans” would imply are: Amanda Chase (expected rank was 26, actual rank was 38, for a MINUS 12 score); Bill DeSteph (expected rank was 25, actual rank was 36, for a MINUS 11 score); Mark Peake (expected rank was 30, actual rank was 39, for a MINUS 9 score); Bryce Reeves (expected rank was 24, actual rank was 30, for a MINUS 6 score); Richard Stuart (expected rank was 27, actual rank was 33, for a MINUS 6 score); John Cosgrove (expected rank was 28, actual rank was 32, for a MINUS 4 score); Ryan McDougle (expected rank was 32, actual rank was 34, for a MINUS 2 score); Mark Obenshain (expected rank was 34, actual rank was 35, for a MINUS 1 score); Travis Hackworth (expected rank was 39, actual rank was 40, for a MINUS 1 score).
- Among Senate Democrats, the members who voted more progressively than their districts’ progressive “leans” would imply were: Creigh Deeds (expected rank was 17, actual rank was 5, for a PLUS 12 score); Aaron Rouse (expected rank was 22, actual rank was 10, for a PLUS 12 score); Ghazala Hashmi (expected rank was 18, actual rank was 9, for a PLUS 9 score); Scott Surovell (expected rank was 9, actual rank was 1, for a PLUS 8 score); John Edwards (expected rank was 19, actual rank was 11, for a PLUS 8 score); Jennifer Boysko (expected rank was 11, actual rank was 5, for a PLUS 6 score); Louise Lucas (expected rank was 13, actual rank was 7, for a PLUS 6 score); John Bell (expected rank was 21, actual rank was 17, for a PLUS 4 score); George Barker (expected rank was 15, actual rank was 12, for a PLUS 3 score); Mamie Locke (expected rank was 5, actual rank was 4, for a PLUS 1 score).
- Among Senate Republicans, the members who voted more progressively than their districts’ progressive “leans” would imply are: Emmett Hanger (expected rank was 36, actual rank was 24, for a PLUS 12 score); Todd Pillion (expected rank was 40, actual rank was 30, for a PLUS 10 score); David Suetterlein (expected rank was 37, actual rank was 28, for a PLUS 9 score); Tommy Norment (expected rank was 33, actual rank was 26, for a PLUS 7 score); Jill Vogel (expected rank was 31, actual rank was 25, for a PLUS 6 score); Frank Ruff (expected rank was 35, actual rank was 29, for a PLUS 6 score); Bill Stanley (expected rank was 29, actual rank was 27, for a PLUS 2 score); Steve Newman (expected rank was 38, actual rank was 37, for a PLUS 1 score).
- In the House of Delegates, 50 members scored less progressive than expected based on their districts’ “leans,” while the 50 members scored more progressive than expected based on their districts’ “leans.”
- Among House of Delegates Democrats, members who voted significantly less progressively than their districts’ progressive “leans” would imply include the following: Mark Sickles (expected rank was 17, actual rank was 45, for a MINUS 28 score); Charniele Herring (expected rank was 5, actual rank was 31, for a MINUS 26 score); Vivian Watts (expected rank was 22, actual rank was 47, for a MINUS 25 score); David Bulova (expected rank was 21, actual rank was 42, for a MINUS 21 score); Luke Torian (expected rank was 10, actual rank was 30, for a MINUS 20 score); Jackie Glass (expected rank was 4, actual rank was 24, for a MINUS 20 score); Betsy Carr (expected rank was 2, actual rank was 21, for a MINUS 19 score); Rip Sullivan (expected rank was 14, actual rank was 32, for a MINUS 18 score); Delores McQuinn (expected rank was 15, actual rank was 33, for a MINUS 18 score); David Reid (expected rank was 31, actual rank was 48, for a MINUS 17 score); Jeion Ward (expected rank was 8, actual rank was 25, for a MINUS 17 score); Alfonso Lopez (expected rank was 3, actual rank was 18, for a MINUS 15 score); Sally Hudson (expected rank was 7, actual rank was 20, for a MINUS 13 score); Eileen Filler-Corn (expected rank was 28, actual rank was 40, for a MINUS 12 score); Karrie Delaney (expected rank was 32, actual rank was 44, for a MINUS 12 score); Kathleen Murphy (expected rank was 35, actual rank was 45, for a MINUS 10 score), etc.
- Among House of Delegates Republicans, members who voted significantly less progressively than their districts’ progressive “leans” would imply include the following: Kim Taylor (expected rank was 42, actual rank was 85, for a MINUS 43 score!); Otto Wachsmann (expected rank was 51, actual rank was 85, for a MINUS 34 score); Jason Ballard (expected rank was 45, actual rank was 76, for a MINUS 31 score); Karen Greenhalgh (expected rank was 48, actual rank was 77, for a MINUS 29 score).
- Among House of Delegates Democrats, members who voted significantly more progressively than their districts’ progressive “leans” would imply include the following: Dawn Adams (expected rank was 49, actual rank was 12, for a PLUS 37 score); Elizabeth Guzman (expected rank was 40, actual rank was 4, for a PLUS 36 score); Dan Helmer (expected rank was 46, actual rank was 18, for a PLUS 28 score); Nadarius Clark (expected rank was 34, actual rank was 8, for a PLUS 26 score); Candi Mundon King (expected rank was 30, actual rank was 8, for a PLUS 22 score); Sam Rasoul (expected rank was 26, actual rank was 5, for a PLUS 21 score); Cia Price (expected rank was 20, actual rank was 2, for a PLUS 18 score); Don Scott (expected rank was 24, actual rank was 6, for a PLUS 18 score); Rodney Willett (expected rank was 55, actual rank was 38, for a PLUS 17 score); Wendy Gooditis (expected rank was 44, actual rank was 27, for a PLUS 17 score); Kathy Tran (expected rank was 33, actual rank was 17, for a PLUS 16 score); etc.
- Among House of Delegates Republicans, members who voted more progressively than their districts’ progressive “leans” would imply included the following: Jeffrey Campbell (expected rank was 97, actual rank was 51, for a PLUS 46 score); Terry Kilgore (expected rank was 99, actual rank was 60, for a PLUS 39 score); Matt Fariss (expected rank was 87, actual rank was 53, for a PLUS 34 score); Terry Austin (expected rank was 95, actual rank was 63, for a PLUS 32 score); Todd Gilbert (expected rank was 94, actual rank was 63, for a PLUS 31 score); James Morefield (expected rank was 100, actual rank was 70, for a PLUS 30 score); Nick Freitas (expected rank was 81, actual rank was 56, for a PLUS 25 score); Lee Ware (expected rank was 85, actual rank was 63, for a PLUS 22 score); etc.
Anything else jump out at you?


![Wednesday News: “The Grand Opening of an American Concentration Camp”; Trump Threatens to Arrest Mamdani; “Poorest Americans Would Be Hurt By Trump’s Big Bill”; [VA] GOP nominees share stage, but not unity”; “Hoos your daddy, Virginia?” (Not Youngkin)](https://bluevirginia.us/wp-content/uploads/2025/07/montage0702.jpg)