The 2025 Virginia General Assembly has adjourned “sine die,” which among other things means that it’s time to look back at statistics from the session – including legislators’ “batting average,” from VPAP, and also the most liberal and conservative legislators, per Chaz Nuttycombe/W-Nominate. But first, check out the usual slew of caveats that should apply to the “batting averages,” as these numbers can be *highly* misleading if you look at them the wrong way, or if you fail to present the numbers with explanation, important context, etc. With the caveats, though, the “batting averages” can be interesting and informative. So with that, see below for the scores, as well as a few things that jumped out at me.
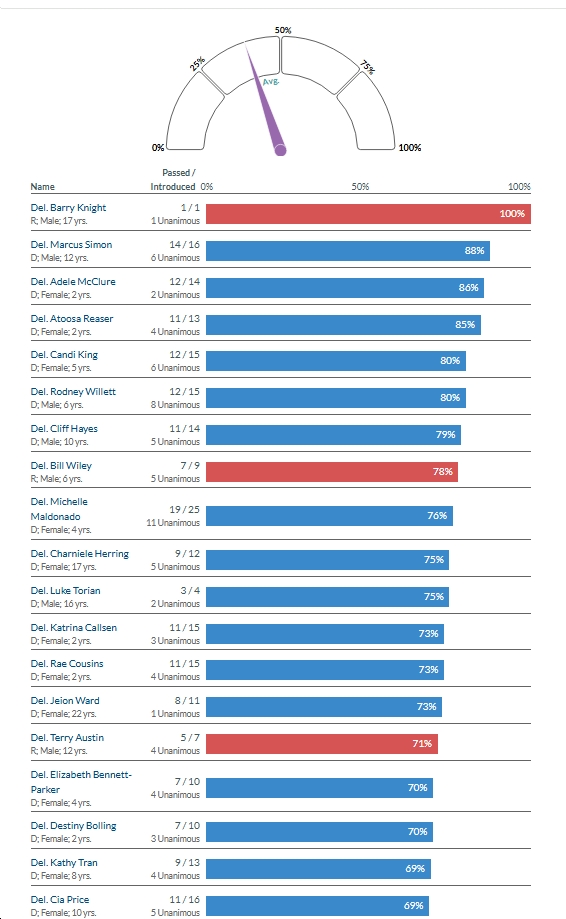
- The average House of Delegates member “pass rate” this session was 40%. That’s down from 46% of introduced bills which ended up passing in 2024 – also down slightly from 43% in 2023, the same as the 40% in 2022, but down significantly from 57% in 2021.
- By party, House Republicans passed just 18% of their introduced bills (down from 26% last year), while House Democrats passed 57% (up from 53% last year). Senate Republicans passed just 32% of their introduced bills (down from 40% last year) – compared to 56% for Senate Democrats (down a few points from 63% last year). Male delegates passed 33% of their introduced bills vs. 53% for female delegates. And male Senators passed 43% of their introduced bills vs. 50% for female Senators (presumably these numbers are skewed by the fact that Republicans are overwhelmingly male, while Democrats are much more representative of Virginia’s gender balance). Delegates with just 0-4 years of seniority passed just 35% of their introduced bills while those with 11-15 years of seniority passed 44% of their introduced bills. You can slice and dice these numbers any way you’d like, so play around with it on VPAP if you’re so inclined.
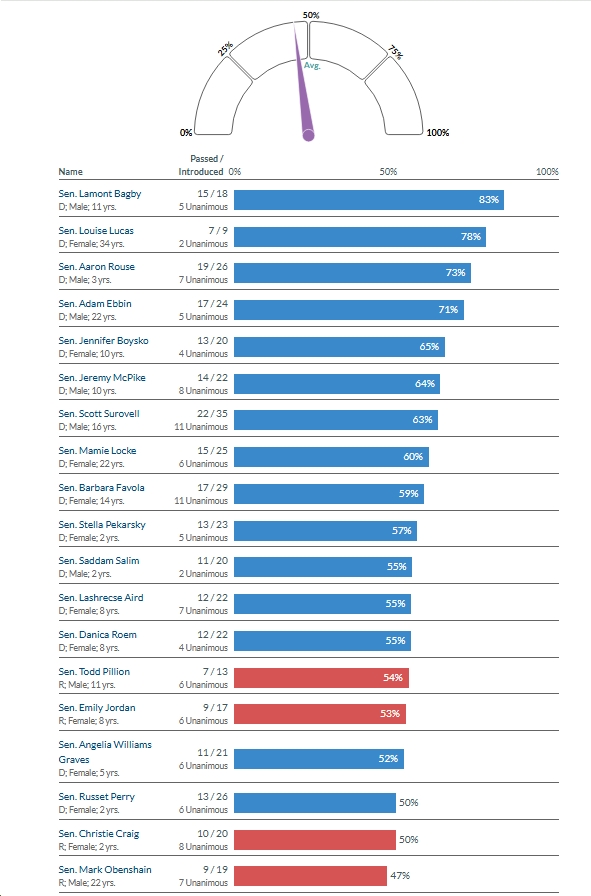
- The highest 13 “batting averages” in the State Senate are all held by Democrats – Lamont Bagby (83%), Louise Lucas (78%), Aaron Rouse (73%), Adam Ebbin (71%), Jennifer Boysko (65%), Jeremy McPike (64%), Scott Surovell (63%), Mamie Locke (60%), Barbara Favola (59%), Stella Pekarsky (57%), Saddam Salim (55%), Lashrecse Aird (55%) and Danica Roem (55%).
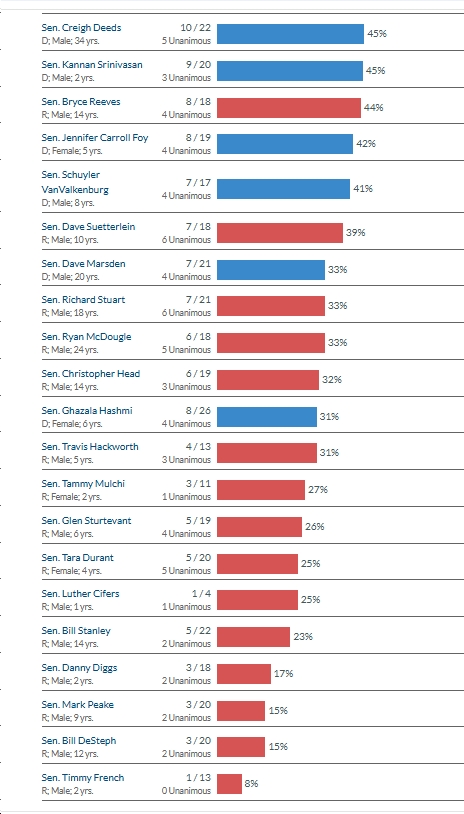
- Not surprisingly, some of the most extreme/MAGA and/or non-serious State Senators – Tammy Mulchi (27%), Tara Durant (25%) Luther Cifers (25%), Bill Stanley (23%), Danny Diggs (17%), Mark Peake (15%), Bill DeSteph (15%), Timmy French (8%) – had the lowest “batting averages” – all under 30%. Pitiful. Although Mark Obenshain, who is as far-right as they come, somehow managed a 47% batting average, so there’s not a perfect correlation here by any means.
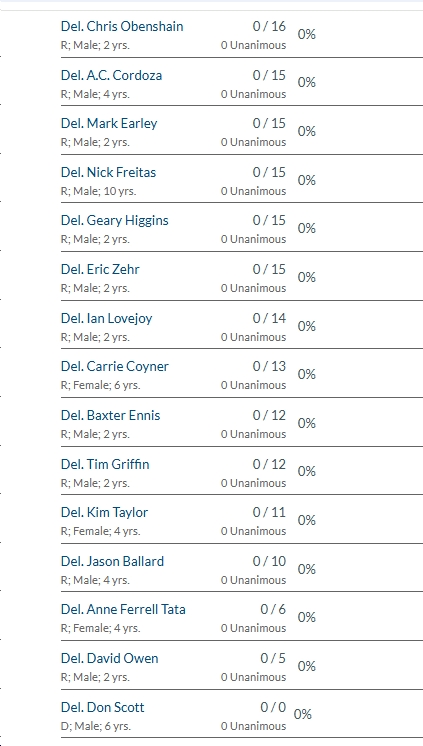
- In the House of Delegates, the worst “batting averages” were far-right/MAGA Republicans and/or Republicans in vulnerable/competitive seats, with some of the worst (all batting ZERO) being Chris Obenshain (0/16), AC Cordoza (0/15), Mark Earley (0/15), Geary Higgans (0/15), Eric Zehr (0/15), Nick Freitas (0/15), Ian Lovejoy (0/14), Carrie Coyner (0/13), Baxter Ennis (0/12), Tim Griffin (0/12), Kim Taylor (0/11), Jason Ballard (0/10), Anne Tata (0/6), and David Owen (0/5). Note that Freitas went 1/13 last year and 0/16 in 2023, making him 1/44 over the past three years – pretty close to completely worthless as a legislator, whether Republicans or Democrats are in charge – but he sure does like bloviating on the House floor, on Twitter, on YouTube, etc.! (Finally, note that Speaker Don Scott should NOT have a 0% batting average, as he introduced no bills – the usual practice among Speakers – and thus should have an “N.A.” for batting average — or infinite, if you’re arguing you should divide by zero)…
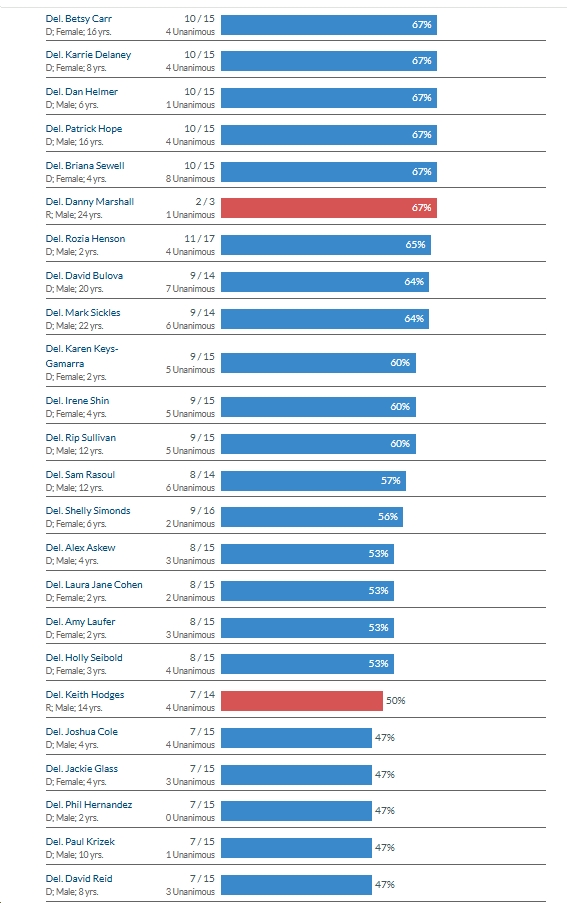
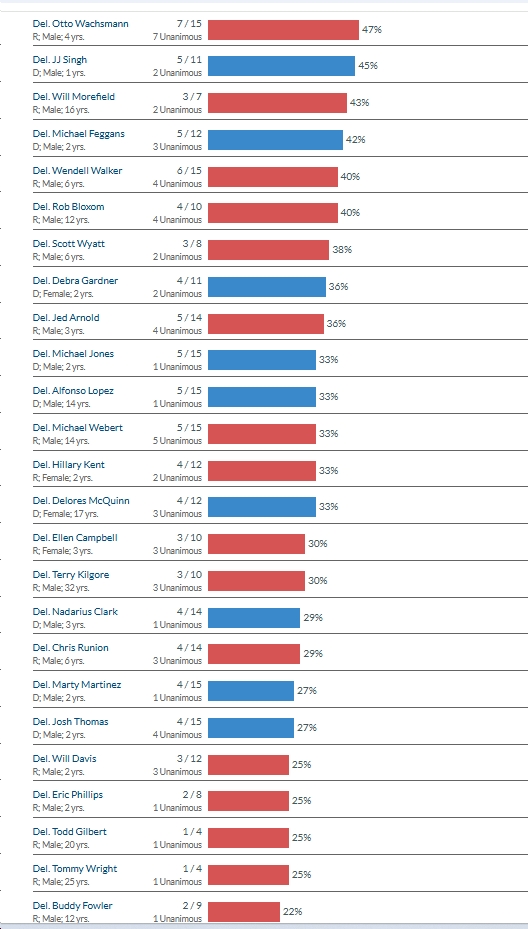
- Overwhelmingly, the highest “batting averages” in the House of Delegates were Democrats – Marcus Simon (88%), Adele McClure (86%), Atoosa Reaser (85%), Candi King (80%), Rodney Willett (80%), Cliff Hayes (79%), Michelle Maldonado (76%), Charniele Herring (75%), Luke Torian (75%), Katrina Callsen (73%), Rae Cousins (73%), Jeion Ward (73%), Elizabeth Bennett-Parker (70%), etc. The lowest Democratic “batting averages” in the House of Delegates were Vivian Watts (14%), Kelly Fowler (20%), Josh Thomas (27%), Marty Martinez (27%) and Nadarius Clark (29%) – not sure what the stories are in those folks, but I’m definitely curious to learn more…
There’s tons of information here, but a couple more things that jumped out at me were:
- Glen Sturtevant (who’s morphed from being a relatively “moderate” Republican to a male version of Amanda Chase) went 5/19 after going 3/20 last year, for a two-year 8/39 “batting average” – not good at all.
- The Senate GOP Leader, Ryan McDougle, has a 33% (6/18) batting average, and the House GOP Leader, Todd Gilbert, has a 25% (1/4) batting average.
So what jumps out for you in these statistics?

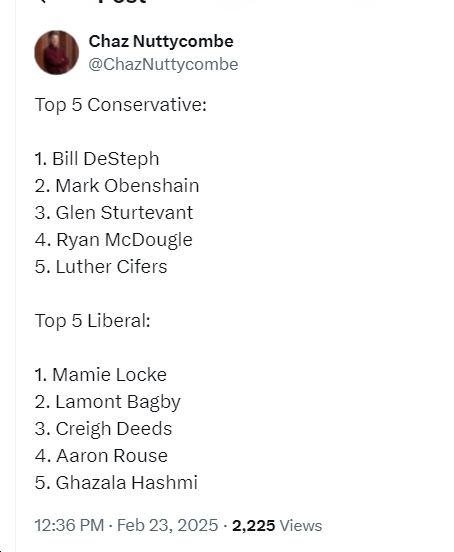
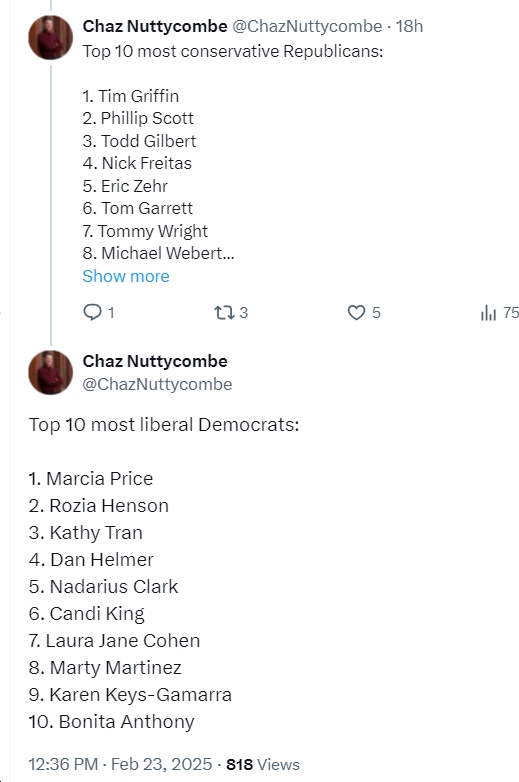
Regarding the statistics from Chaz Nuttycombe/W-Nominate, it will be interesting to compare these to whatever VAPLAN’s scorecard comes up with. Per Chaz’s numbers, the most far-right Virginia State Senators (Bill DeSteph, Mark Obenshain, Glen Sturtevant, Ryan McDougle, Luther Cifers) mostly seems about right (I’m a bit surprised at McDougle). As for the most liberal Virginia State Senators, I’m somewhat surprised that Creigh Deeds is that high in the rankings. No big surprises for the most right-wing House of Delegates members – certainly Nick Freitas and Tim Griffin belong on that list. Does anything surprise you in these lists?