Not surprisingly, there’s been a lot of talk since last Tuesday’s Virginia election about things that went wrong for Democrats, what could be done better, who and/or what is to blame, etc. Among the key areas of discussion has been the issue of why Democrats did so poorly in rural Virginia this election. I’ve got some thoughts on this topic – as does Sam Shirazi (see below) – and some ideas to possibly get at this problem. But first here are some stats re: Democratic performance in some rural counties since 2001, just to show the scope of the challenge/problem:
First, here’s the 2001 gubernatorial election map (Democrat Mark Warner vs. Republican Mark Earley). Note that Loudoun County and Prince William County were both “red” back then, while many areas that are currently “red” were then “blue.” For instance, in 2001, Mark Warner got a whopping 65.7% in Buchanan County in far-Southwestern Virginia (SWVA), 61.0% in Dickenson County (also in far SWVA), 58.5% in Wise County (also in far SWVA), 59.0% in Alleghany County (in western Virginia), etc. For comparison purposes, in 2021, Terry McAuliffe got just 15.1% (!) in Buchanan County, just 19.4% (!) in Dickenson County, just 15.6% in Wise County, and just 25.0% in Alleghany County. A total collapse, in other words, from solid majorities won by Democrat Mark Warner in 2001. Of course, Warner made a huge effort in SWVA in 2001, as he had in his US Senate run against John Warner in 1996, including sponsoring a NASCAR truck and commissioning a bluegrass song (“Mark Warner is a good ol’ boy from up in NOVA-ville; He understands our people, the folks up in the hills”).

Now, here’s the 2005 gubernatorial election map (Democrat Tim Kaine vs. Republican Jerry Kilgore). Note that most of far SWVA is now “red,” while Loudoun County and Prince William County are now “blue” (although only by small margins at that point). Still, Kaine at least held his own in far SWVA, winning 52.2% in Buchanan County (down from Warner’s 65.7% four years earlier); 48.0% in Dickenson County (down from Warner’s 61.0% four years earlier); 38.2% in Wise County (down from Warner’s 58.5% four years earlier); and 53.9% in Alleghany County (down from Warner’s 59.0% four years earlier). Note that Kaine had both the strong ties to Mark Warner, as well as to SWVA via his wife (Anne Holton, the daughter of former Gov. Linwood Holton, who grew up in Big Stone Gap in far SWVA, went to college at Washington & Lee, etc.).
Of course, Leslie Byrne – the Dems’ LG nominee in 2005 – was a liberal from Northern Virginia, with no ties to SWVA, yet also won Buchanan County (with 56.2% of the vote!), won Dickenson County (with 52.4% of the vote), lost Wise County but did respectably (with 41.2% of the vote) and won Alleghany County (with 52.3% of the vote). So it wasn’t just having ties to SWVA or to rural Virginia that mattered, apparently (note that Byrne ran as an unabashed, strong liberal and pro-union Democrat who ripped so-called “right-to-work” laws as “right-to-be-poor” laws, and it didn’t at all appear to hurt her in rural Virginia).

Now, here’s the 2006 Jim Webb (D) vs. George Allen (R) U.S. Senate election map. Note that Jim Webb also had very strong family ties to SWVA, as well as a record as US Navy Secretary in the Reagan Administration, a decorated war hero, etc. As you can see, Webb won Loudoun County and Prince William County – again by VERY narrow margins – while winning Buchanan County (56.6% of the vote), winning Dickenson County (54.6% of the vote), holding his own in Wise County (46.3% of the vote), and winning Alleghany County (51.6%) of the vote.
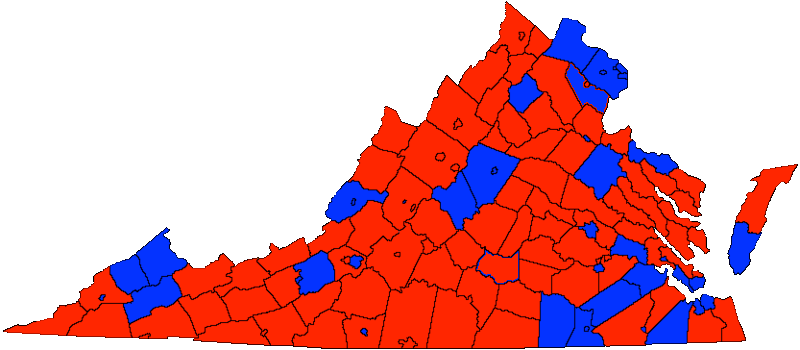
Now, here’s the 2008 presidential map. In just two years, note the changes: Buchanan County (Obama got a respectable 46.5%, down about 10 points from Webb’s 56.6% of the vote two years earlier), Dickenson County *(Obama got 48.5%, down about 6 points from Webb’s 54.6% of the vote in 2006), Wise County (Obama only got 35.3% of the vote, down 11 points from Webb’s 46.3% of the vote in 2006), and Alleghany County (Obama got 48.2% of the vote, down about 3 points from Webb’s 51.6% in 2006). As for Loudoun County and Prince William County, Obama won those with 53.7% and 57.5% of the vote, respectively. So getting a bit more similar to today’s Virginia electoral map, but definitely not the same by any means…
Now, a massive change, with Democrats getting wiped out in 2009, despite running a rural Democrat (Creigh Deeds, from Bath County) as their gubernatorial candidate, as well as geographically balanced ticket, with Jody Wagner from Hampton Roads for LG and Steve Shannon from Northern Virginia for AG. In this election – which featured the intense, “Tea Party” backlash to the nation’s first African-American president, who also inherited an economic disaster and the war in Iraq from President George W. Bush – Deeds only got 41.3% of the vote statewide against Republican Bob McDonnell’s 58.6%. In Buchanan County, Deeds only got 36.7% of the vote (down from Obama’s 46.5% the previous year). In Dickenson County, Deeds only got 39.5% of the vote (down from Obama’s 48.5% of the vote the previous year). In Wise County, Deeds only got 29.6% of the vote (down from Obama’s 35.3% of the vote the previous year). And in Alleghany County, which borders Deeds’ home county of Bath, Deeds got 61.2% of the vote (up from Obama’s 48.2% of the vote the previous year). As for Loudoun County and Prince William County, Deeds only got 38.8% and 41.2% of the vote, as Democratic turnout basically collapsed, with under 2 million total votes cast in the election (compared to about 3.2 million in the 2021 gubernatorial election). So yeah, Virginia can be a “blue” state, but it also can be “red” if Democratic voters don’t show up and Republican voters DO show up. Also, again, ntoe that nominating a rural Dem didn’t help, either in the rural parts of the state OR the urban and suburban parts. At least not in that election, with those candidates…

Now here’s a map of the 2013 Virginia gubernatorial election, which Terry McAuliffe won narrowly (2.5 points) over Ken Cuccinelli. Total turnout in this election was 2.2 million – better than 2009, but still not great. As for the map, as you can see, McAuliffe did well in Northern Virginia and not at all well in SWVA or most other rural parts of Virginia. For instance, McAuliffe only got 30.1% in Buchanan County (down from Mark Warner’s 65.7% in 2001 and Kaine’s 52.2% in 2005), just 34.5% in Dickenson County (down from Warner’s 61% in 2001 and Kaine 48% in 2005), just 26.4% in Wise County (down from Warner’s 58.5% in 2001 and Kaine’s 38.2% in 2005), and just 39.4% in Alleghany County (a county Mark Warner won with 59% in 2001, Tim Kaine won with 53.9% in 2005, Jim Webb won with 51.6% in 2006 and Barack Obama almost won in 2008). Bottom line: clearly something changed between around 2001-2008 and 2009-2013. What, though? The rise of Facebook (which fully opened to the public in late 2006)? A relative increase in influence by right-wing media (Fox “News,” right-wing talk radio, etc.)? The demise of local newspapers, which accelerated in the 2000s as Craigslist, Facebook, etc. sucked away their revenue streams and drove a lot of them out of business? Economic problems? A backlash to the nation’s first African-American president? Democrats neglecting/ditching the “50-state strategy?” Other factors?

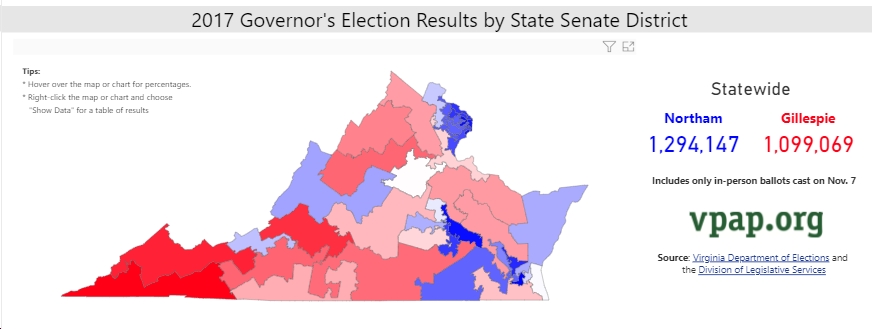
Now here’s a map of the 2017 gubernatorial election, which was a “blue wave” backlash-to-Trump election, in which Democrat Ralph Northam clobbered Republican Ed Gillespie by almost 9 points, with 2.6 million votes cast. In that election, Loudoun County and Prince William County went deep-“blue” (59.4% and 61.1%, respectively). Meanwhile, Northam only got 23.4% in Buchanan County (down from McAuliffe’s 30.1%), just 27.8% in Dickenson County (down from McAuliffe’s 34.5%), just 22.1% in Wise County (down from Northam’s 26.4%), and just 33.6% in Alleghany County (down from McAuliffe’s 39.4%). This, despite Northam being a rural Democrat, albeit from the eastern end of the Commonwealth, and also a relatively “moderate” Democrat who went to college at VMI. So clearly, it’s not the candidate per se, it’s something structural and long-term going on here. I’d argue it’s heavily related to changes in media – both broadcast (Fox “News,” right-wing talk radio, etc., as local media continued its collapse) and social media (particularly Facebook, which increasingly seemed to be gearing itself to encouraging “clicks” and time on the platform based on anger/vitriol). Clearly, if the only news you get is either right-wing or “framed” in a right-wing-friendly way, it’s not surprising that you’d start seeing things more that way. Any other theories?
Now, here’s the 2020 presidential election map – huge margins for Biden in Northern Virginia (61.5% Biden in Loudoun County, 62.6% Biden in Prince William County, 69.9% Biden in Fairfax County), the Richmond area (82.9% Biden in Richmond, 63.6% Biden in Henrico County, 52.5% Biden in Chesterfield County) and Hampton Roads (71.7% Biden in Norfolk, 69.4% Biden in Portsmouth, 51.6% Biden in Virginia Beach, etc.); also huge margins for Trump in places like Buchanan County (83.5% Trump!), Dickenson County (78.7% Trump), Wise County (80.5% Trump) and Alleghany County (71.4% Trump). A total of 4.5 million votes were cast in this election – really amazing.
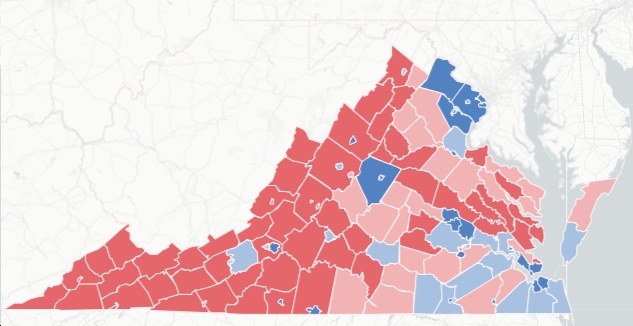
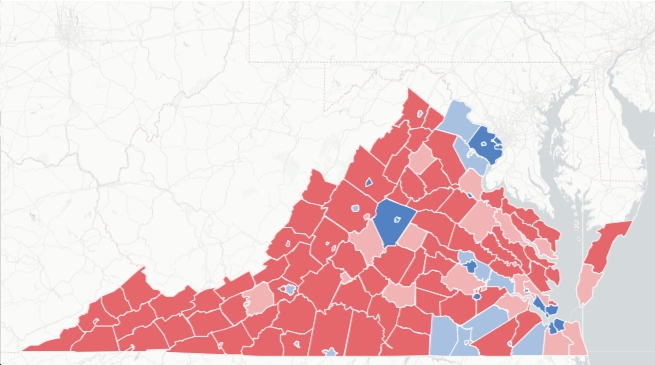
Finally, here’s a map of the 2021 gubernatorial election, which Republican Glenn Youngkin won over Terry McAuliffe by just over 2 points, with over 3.2 million votes cast. The problem for McAuliffe wasn’t that Democrats didn’t turn out – McAuliffe got nearly 1.6 million votes, about 200k more than Northam got in his 2017 landslide victory. The problem, instead, was that Republicans turned out in droves, up from not even 1.2 million for Gillespie in 2017 to nearly 1.7 million for Youngkin in 2021. And, amazingly, McAuliffe’s share of the vote in rural/”red” areas was really REALLY low. In Buchanan County, for instance, McAuliffe got just 15.1%, down from his 30.1% share in 2013 – cut in half! And in Dickenson County, McAuliffe got just 19.4%, down sharply from his 34.5% in 2013. In Wise County, McAuliffe got just 15.6% of the vote, down from his 26.4% share in 2013. WTF? And in Alleghany County, McAuliffe got just 25.0% of the vote, down from his 39.4% share in 2013. Again, WTF? I mean, what changed so much between 2013 and 2021?
Again, I’m going with my #1 reason being the decline of local media, the continued rise of Facebook – and its big 2018 change to its algorithm in favor of rewarding “outrage,” plus Trump’s and many Republicans’ pushing the “Big Lie” for several years, plus the media refusing to call out lies and doing b.s. “both sides”/false equivalence coverage of everything, plus Youngkin having almost unlimited money to really get out his vote and to define himself (over the summer, Democrats basically were refueling their “tanks” after their primary, while the Republicans were busy on TV, in the field, etc. – major head start for the “red” team), plus Youngkin using a lot of that money to stoke anger, racial animosity, etc.,, in the classic Lee Atwater/”Southern Strategy” mode (and yes, if you haven’t seen the movie “Boogie Man: The Lee Atwater Story,” definitely check it out). Now, of course, none of this is meant to absolve the Democrats from mistakes in a variety of areas, but overall, I’d point to structural and systemic forces, much more than specific individuals (maybe I’ve been watching too much “Foundation” – “psychohistory!” – recently? LOL). And I’d recommend, strongly, that Democrats and Congress do something about this situation, by reining in Facebook BIG TIME – it’s a menace, not just in the US but around the world – and also by building a media messaging machine of their own (because no matter how good your message is, it’s useless if people aren’t hearing it).
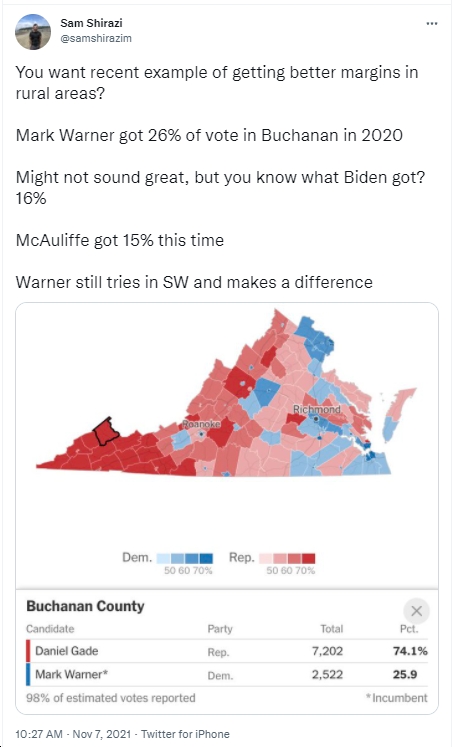
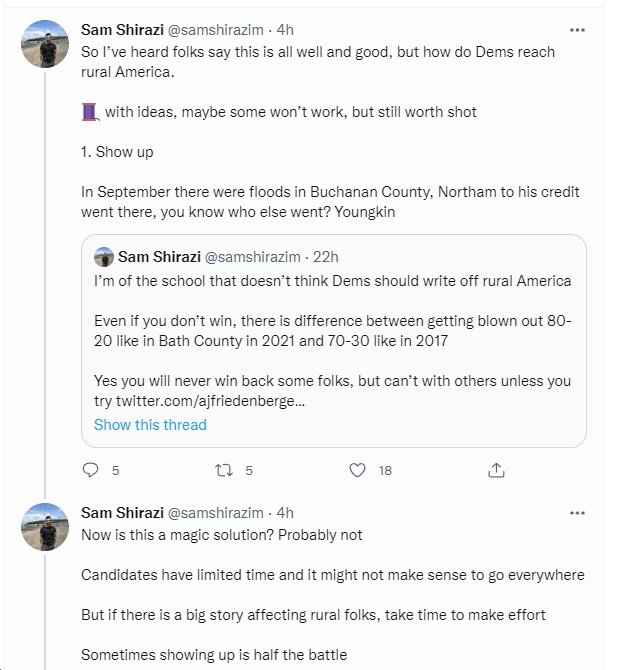
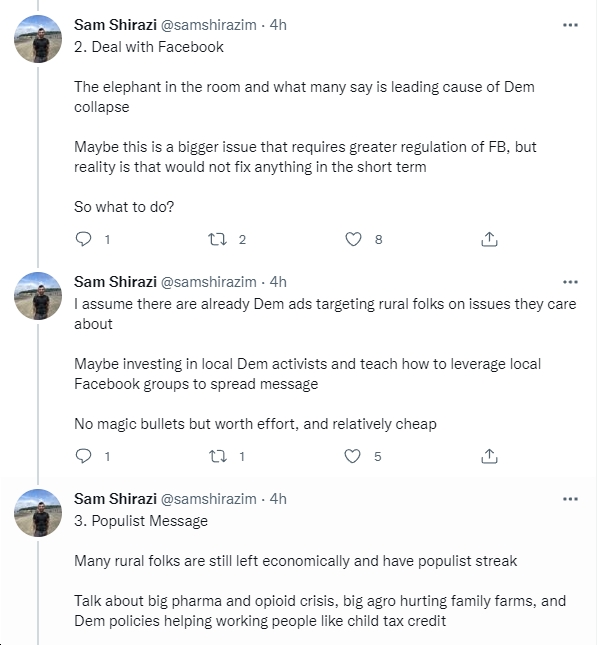
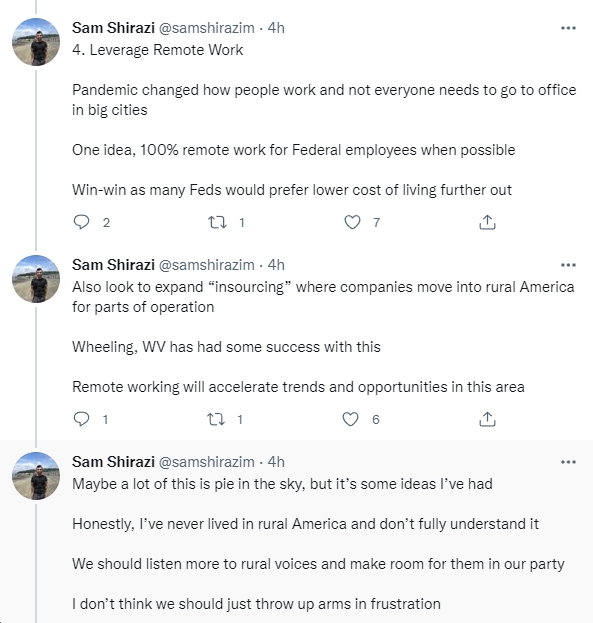
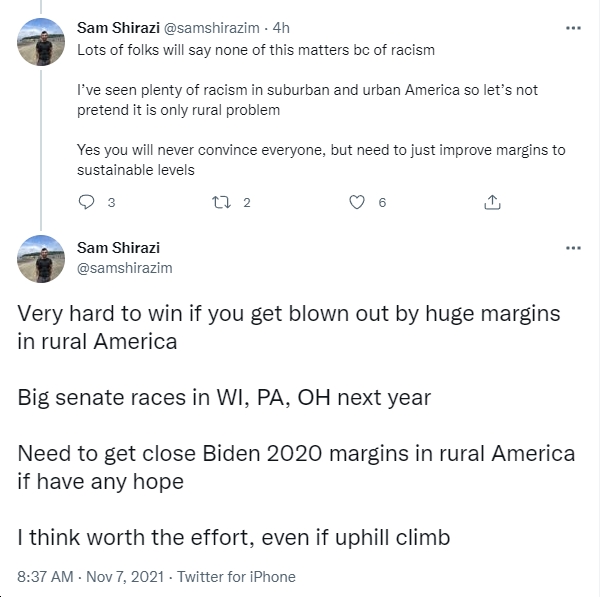
Anyway, this was much longer than I thought it would be, but hopefully useful. With that, see below for some of Sam Shirazi’s thoughts about how Dems might be able to work at reversing their decline in rural America, and also feel free to share yours in the comments section.


 Sign up for the Blue Virginia weekly newsletter
