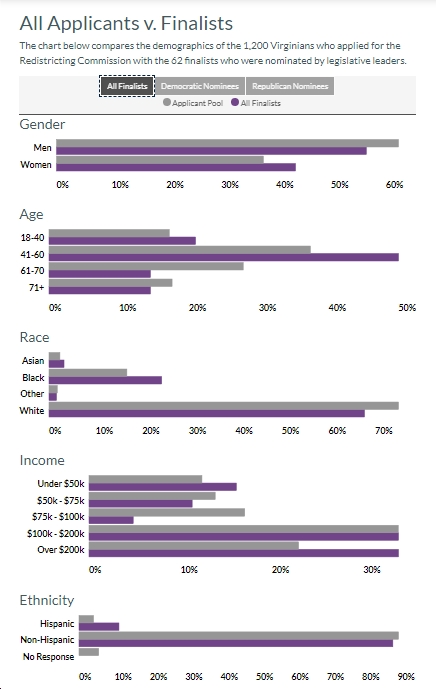
Yesterday, we got the names of the finalists for the citizen members of the Virginia Redistricting Commission. Now, courtesy of VPAP, we’ve got some detailed demographic information (see graphics below). Here are some takeways:
- All finalists: 56% male/44% female (“compared to 38% of all applicants); “50%…are between 41 and 60, compared to 37% of all applicants; 15%…between 61 and 70, compared to 28% of all applicants; 15%…71 or older, compared to 18% of all applicants”; “24%…Black, compared to 17% of all applicants…68%…White, compared to 75% of all applicants”; “34%…earn between $100,000 and $200,000, compared to 34% of all applicants; 34%…earn over $200,000, compared to 23% of all applicants”; 11%…Hispanic, compared to 4% of all applicants; 89%…Non-Hispanic, compared to 90% of all applicants”
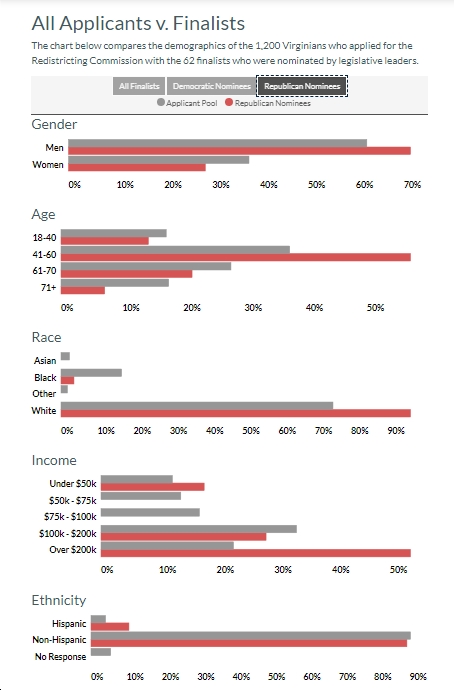
- Republican-selected finalists: “29%…women, compared to 38% of all applicants”; “0%…Asian, compared to 2% of all applicants; 4%…Black, compared to 17% of all applicants…96%…White, compared to 75% of all applicants”; “29%…earn between $100,000 and $200,000, compared to 34% of all applicants; 54%…earn over $200,000, compared to 23% of all applicants”; “11%…Hispanic, compared to 4% of all applicants; 89%…Non-Hispanic, compared to 90% of all applicants”
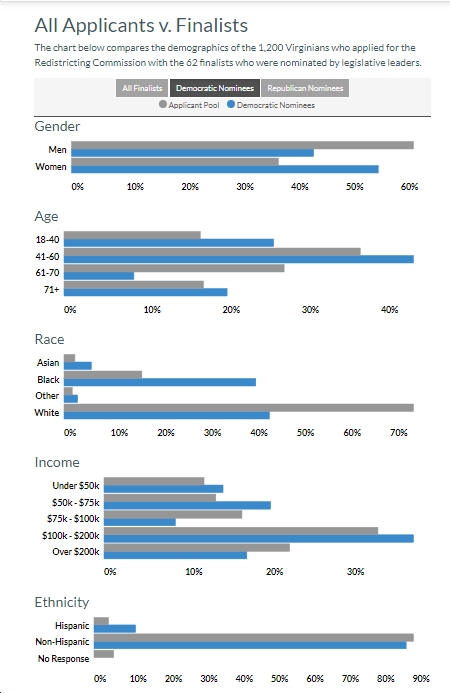
- Democratic-selected finalists: “56%…women, compared to 38% of all applicants”; “6%…Asian, compared to 2% of all applicants; 41%…Black, compared to 17% of all applicants…44%…White, compared to 75% of all applicants”; “15%…earn less than $50,000, compared to 12% of all applicants 38%…earn between $100,000 and $200,000, compared to 34% of all applicants; 18%…earn over $200,000, compared to 23% of all applicants”; “12%…Hispanic, compared to 4% of all applicants; 88%…Non-Hispanic, compared to 90% of all applicants”
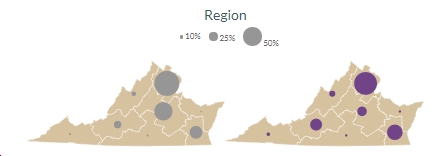
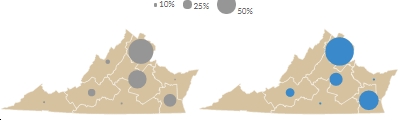
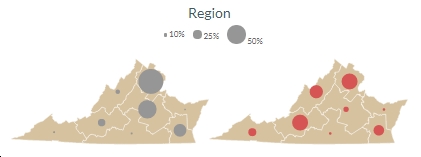
Regional breakdown:
- “25% of applicants are from the Central region; 34% of applicants are from the Northern region; 3% of applicants are from the Southside region; 17% of applicants are from the Hampton Roads region; 6% of applicants are from the Valley region; 10% of applicants are from the West Central region; 3% of applicants are from the Southwest region; 2% of applicants are from the Eastern region.”
- “7% of Republican Nominees are from the Central region; 21% of Republican Nominees are from the Northern region; 4% of Republican Nominees are from the Southside region; 14% of Republican Nominees are from the Hampton Roads region; 18% of Republican Nominees are from the Valley region; 21% of Republican Nominees are from the West Central region; 11% of Republican Nominees are from the Southwest region; 4% of Republican Nominees are from the Eastern region.”
- “18% of Democratic Nominees are from the Central region; 38% of Democratic Nominees are from the Northern region; 3% of Democratic Nominees are from the Southside region; 26% of Democratic Nominees are from the Hampton Roads region; 0% of Democratic Nominees are from the Valley region; 12% of Democratic Nominees are from the West Central region; 0% of Democratic Nominees are from the Southwest region; 3% of Democratic Nominees are from the Eastern region.”